Featured
June 26, 2017

European midstream gas infrastructure in focus

5 min

Subscribe to our blog

Midstream gas assets are coming back into focus after a lull across the first half of this decade. A 20% decline in European gas demand between 2010 and 2015, caused a pronounced erosion of midstream asset utilisation and capacity value. But the sands are shifting as European gas supply dynamics change and demand continues to recover.

Midstream asset transaction momentum is starting to build again. Last year saw EPH sell a 30% stake in its key Slovakian transit pipeline & storage business, with Global Infrastructure Partners selling its 45% stake in the Transitgas pipeline into Italy. EDF, Uniper & Edison are currently in the process of selling equity stakes in French and Italian regas terminals. The gas storage market is also coming to life, particularly in the UK given the permanent closure of Rough.

In the more than 20 years we have been working in European energy markets we cannot remember a time of greater divergence in views on gas market evolution. This lack of consensus on supply mix, flow patterns, midstream asset utilisation and capacity value is an environment of opportunity for investors. But how do you think about midstream asset value?

Europe in a state of transition

The key force acting on the supply side of the European gas market is rising import dependency. This is reflected in increasing Russian import volumes in 2016-17, accompanied by an ongoing shift in flow patterns as Gazprom favours the Nordstream (Baltic) routing over Ukraine. European LNG imports and regas terminal utilisation have also risen to their highest level in five years.

The fact that Russian and LNG imports are rising together reflects growth in European gas demand, with a 27  bcma (5.4%) increase in 2016. 20 bcma of this was driven by higher power sector demand as coal plants were switched for CCGTs. The evidence so far in 2017 points to a continuation of that trend.

Even the substantial overhang of gas supply flexibility is starting to abate. Centrica Storage has now announced permanent closure of its large UK Rough storage facility (more than 70% of UK working gas volume). Further storage closures and capacity reductions are looming on the Continent. And European upstream flexibility is declining as field production matures (particularly given rapidly lowered volumes from the Dutch Groningen field).

Midstream infrastructure map

A map is a good place to start when considering the impact of this European gas market transition on  midstream gas infrastructure. Diagram 1 shows the key supply routes into the main European market hubs. Volumes of storage capacity and LNG regas terminal capacity are also shown.
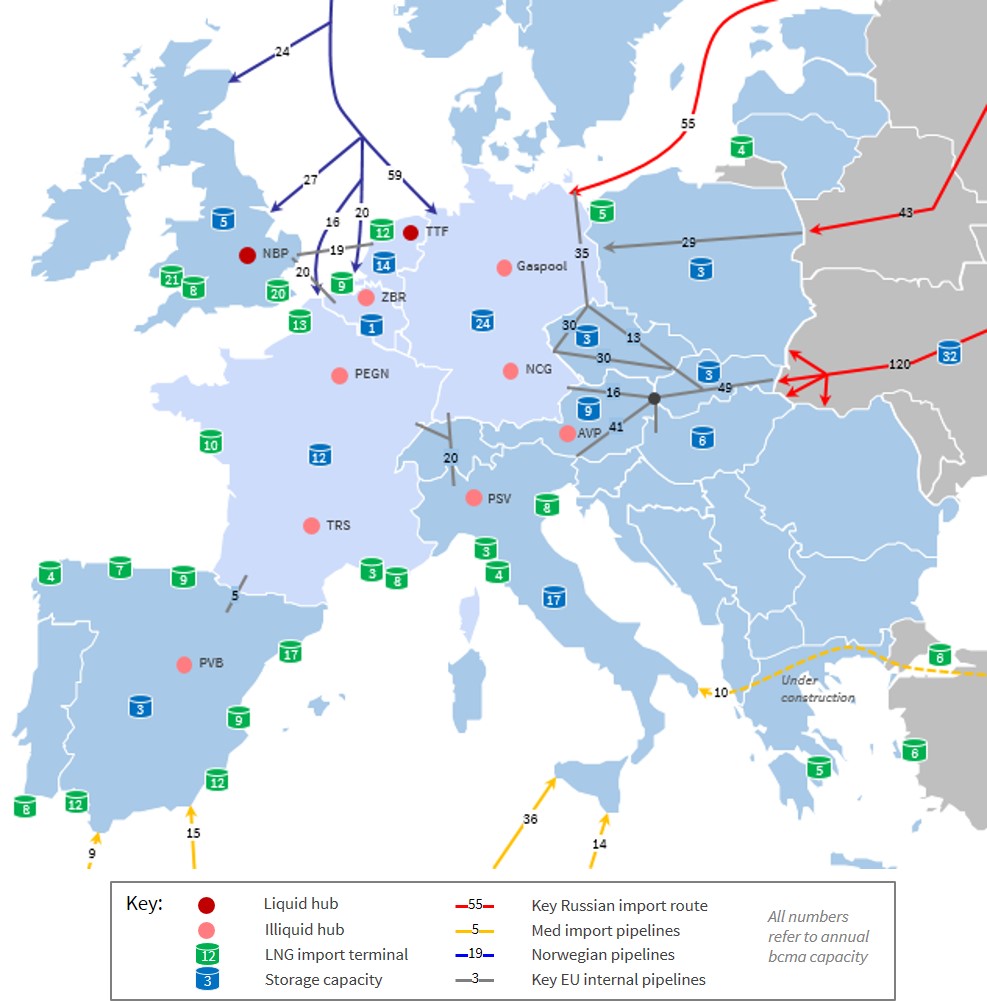
Diagram 1: Summary of key European midstream infrastructure

The structural trend behind the transformation of the European gas market, is a terminal decline in production, which is projected to fall from 246 bcma in 2016 to 165 bcma by 2025 (volumes including Norway). This widening gap is driving an increase in European import dependency.

Europe’s sources of imported supply can be grouped into four categories:

  1. Russia: Europe’s dominant existing supplier with around 150 bcma of long term contracted ‘take or pay’ volumes, and a further 100 bcma of ‘shut in’ West Siberian gas production that could support additional sales to Europe.
  2. LNG: Europe has ample regas capacity headroom and there is more than 150 bcma of new global liquefaction capacity under construction, but European LNG import volumes will strongly depend on demand growth in Asia.
  3. Norway: Norwegian production is managed to an annual target (~110 bcma), which is set to decline into next decade as existing fields mature.
  4. Mediterranean: North African supply from Algeria and Libya is set to decline into next decade, partially offset by limited growth in imports of Azerbaijani gas into Italy via Southstream.

In a nutshell, the next stage of evolution of the European gas market comes down to a battle between Russian and LNG imports. In our briefing pack on midstream assets we set out two scenarios contrasting ‘LNG Dominance’ vs ‘Russian Dominance’. The volumes and routing of Russian vs LNG imports is set to be the key factor driving midstream asset utilisation and capacity value into next decade.

5 drivers of midstream asset value

One of Timera Energy’s key areas of engagement is advising ‘buy side’ investors on the value of pipelines, regas terminals and storage assets. In doing this we aim to understand and quantify the impact of 5 key drivers of asset value. These are summarised in the table below along with examples. Extrinsic value of UK regas & storage capacity set to rise with spot price volatility given Rough closure

Table 1: 5 drivers of European midstream asset value:

Driver Dynamics Example
1. Utilisation Evolution of supply volumes, routes and flow patterns drive capacity utilisation LNG import growth will drive regas utilisation and pipeline flow volumes in UK, Netherlands & France
2. Constraints Physical and contractual constraints drive capacity value premia Value premia from contractual pipe constraints into Italy and physical Spain/France pipe constraints
3. Flexibility value Interaction between physical asset flex and market price signals drives asset extrinsic value Extrinsic value of UK regas & storage capacity set to rise with spot price volatility given Rough closure
4. Liquidity access Access to liquid hub price signals drives ability to monetise capacity value Dutch & UK storage assets have clean access to liquid forward curves vs e.g. Czech & Slovak assets
5. Regulation Regulations on access, tariff structure and security of supply impact capacity value Regulated tariffs drive competitive variable cost dynamics impacting regas & pipeline utilisation

Source: Timera Energy


There are of course other important considerations driving midstream asset value, for example legacy long term contract position, expansion options, interaction with adjacent assets and commercial flexibility to monetise capacity value (e.g. via overselling). But if you can develop a structured view on the 5 drivers in the table and quantify their impact on asset risk/return it builds a strong investment case foundation.

Article written by David Stokes & Olly Spinks

Client briefing: European midstream gas

A Timera Energy client briefing pack on midstream assets can be downloaded here:

European midstream gas: Asset value drivers & market evolution

European midstream gas infrastructure in focus