Intermarket linkages are increasingly driving energy asset value and risk. Market linkages across different commodities are becoming more important e.g. the relationships from LNG to gas to power. Pricing dynamics and border flows across European power markets are also becoming increasingly interdependent.
Today we use a 5 chart case study to illustrate the growing importance of linkages across Western European power markets. We then finish by challenging what this means for asset owners and investors.
Chart 1: The switching link
Asian LNG demand growth has ground to a standstill over the last 12 months. As global LNG supply continues to increase, Europe is absorbing surplus LNG, primarily via price responsive demand in European power markets.
In linkage terms, LNG imports rise → European hub prices decline → CCGT competitiveness increases vs coal → power sector gas demand rises to absorb the incremental LNG.
Chart 1 illustrates the trend of increasing gas plant competitiveness versus coal over the last year (in the context of the last 5 years).
Chart 1: Coal vs gas % share of generation output across the ‘EU 6’
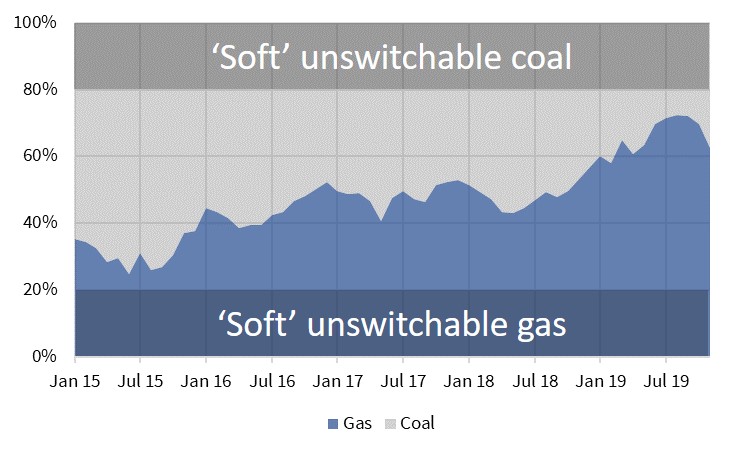
Source: Timera Energy, ENTSOE
For the purposes of this article we have focused analysis on what we refer to as the ‘EU 6’ countries, covering the key Continental power markets in Western Europe (Germany, France, Netherlands, Belgium, Italy & Spain).
Chart 1 shows the gas vs coal plant generation share (of combined gas and hard coal output). As gas prices have fallen, gas plant share has risen from below 50% in Summer 2018 to above 70% entering this winter.
The ‘soft’ unswitchable ranges represent the proportion of gas and hard coal plants which are non-price responsive for switching purposes, i.e. neither dispatched on a variable cost basis, nor required for system constraints.
The switching of gas for coal plants within European power markets is a key driver of power price dynamics. These two plant types dominate the setting of marginal power prices.
However switching is not the only factor driving power prices, load factors and cross border flows. A pan-European market view is becoming increasingly important to understand these dynamics as we illustrate with the next four charts.
Chart 2: Thermal flex balances the market
We now focus in on Nov-2019 in order to demonstrate some interesting cross market linkages. Flexible thermal generation output (from gas & coal plant) normally jumps in November as the winter chill sets. But that hasn’t happened so far in 2019. In order to understand why we need to look across several countries and types of generation.
Chart 2 shows average thermal power plant output measured in GW across the ‘EU 6’ countries (covering the gas, coal & lignite fleets).
Chart 2: Thermal generation output across the ‘EU 6’
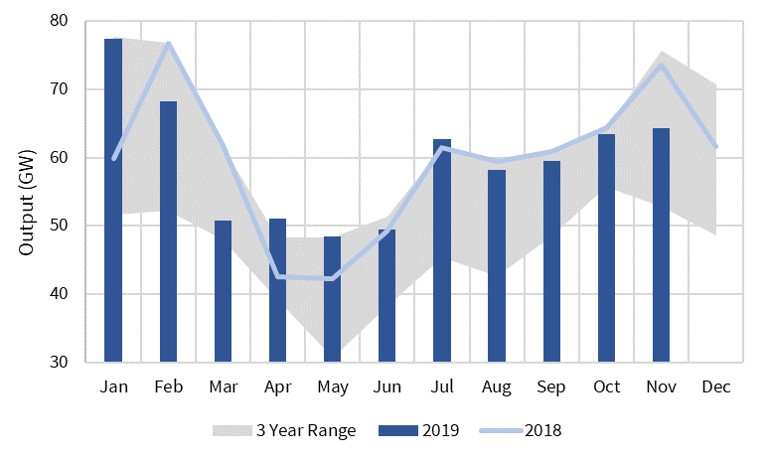
Source: Timera Energy, ENTSOE
The dark blue bars show 2019 levels, which can be contrasted with 2018 levels shown via the light blue line. The grey shaded area shows the output range across the last 4 years (2015-18).
So far in Nov-19, thermal output is 9GW below 2018 levels (based on data up to mid month). Charts 3, 4 & 5 set out some of the drivers behind this decline.
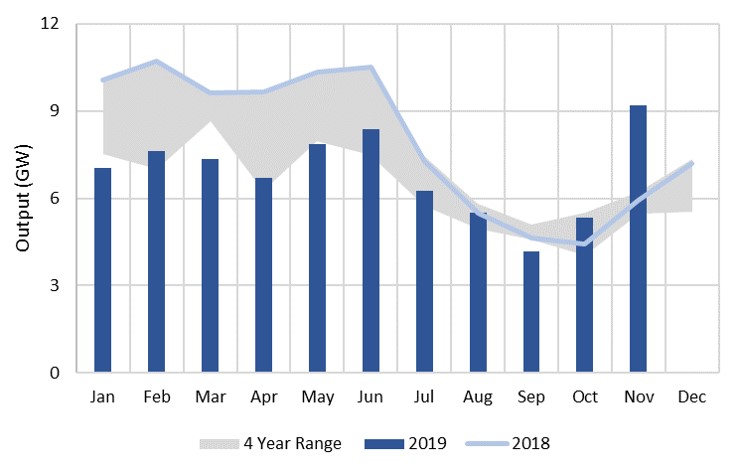
Chart 3: Wind fluctuations
Nov-19 has been a very windy month in Spain. Spanish wind generation output was running at double last year’s level by mid-November as shown in Chart 3.
Chart 3: Spanish wind generation

Source: Timera Energy, ENTSOE
If strong winds continue across November, it looks like it will be an outlier month (e.g. compared to the 4 year range shaded in grey).
Chart 4: Hydro fluctuations
While its been windy in Spain, Nov-19 has been a very wet month in France. High French hydro reservoir levels have boosted hydro generation 50% year-on-year in the first half of November as shown in Chart 4.
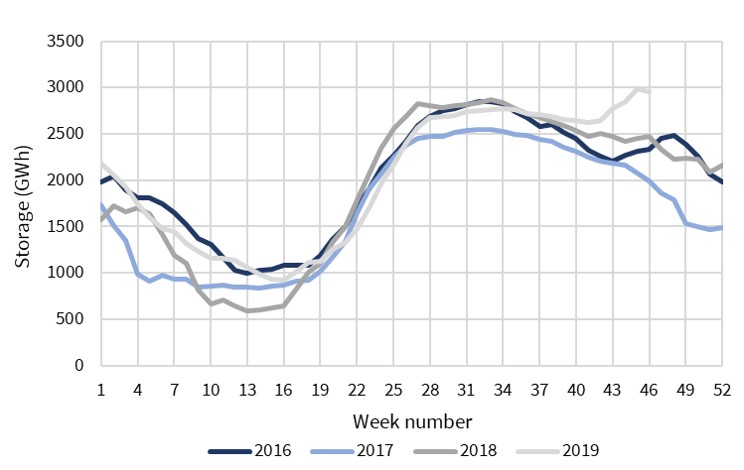
Source: Timera Energy, ENTSOE
French nuclear outages sent jitters through the market earlier this month, as the 2.7GW Cruas was pulled offline after an earthquake in the Ardeche region of France. Higher hydro output has largely offset the impact of this outage so far this winter.
Chart 5: Conventional plant outages
Belgium is a relatively small power market in a pan-European context. But its nuclear output share is high and can have an important impact on neighbouring market balances and pricing dynamics.
This was illustrated in 2018 when Belgium’s ageing nuclear fleet lost multiple reactors due to a combination of planned and unplanned outages. Those reactors are back and running in Q4-2019, with the Belian nuclear fleet displaying an unusually strong performance so far this winter. The year-on-year difference in nuclear output can be seen in Chart 5.
Chart 5: Belgian nuclear generation output

Source: Timera Energy, ENTSOE