Front month Asian & European LNG prices plunged below 3 $/mmbtu during the peak of the Covid demand slump in the summer of 2020.
“The pace & scale of Asian demand growth is the key uncertain factor”
Step forward two years to the summer of 2022 and prices surged to 80 $/mmbtu as Russia cut gas supply to Europe.
Prices for this summer are back in single digits again, with European gas prices down 40% since we flagged the risk of a price plunge 5 weeks ago.
What happens next? We don’t know. But we have a market modelling framework that helps us put some structure around the inherent uncertainty of LNG market evolution.
In today’s article we summarise the supply & demand drivers likely to shape how the LNG market evolves over the next 10 years.
Visualising supply & demand
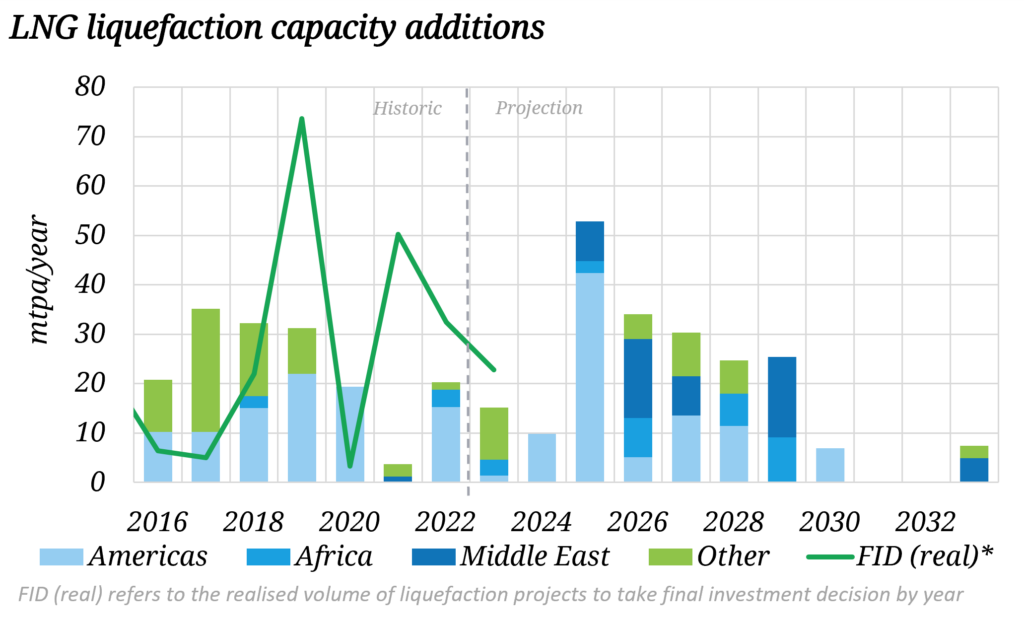
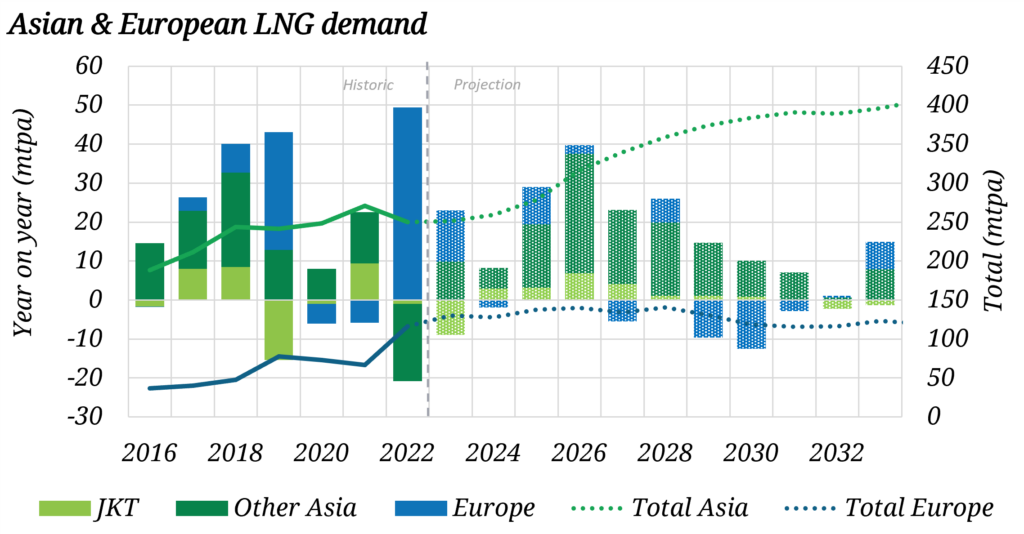
Our global LNG market model captures a build up of country level demand for LNG as well as individual supply projects. In Chart 1 we provide a summary view of a scenario of supply & demand evolution. The chart shows:
- Incremental supply by region in the form of liquefaction capacity (top panel)
- Demand by region, y-o-y growth against the left axis and total demand against the right hand axis (bottom panel).
5 takeaways from these charts:
- There are long lead times for supply to respond to market prices (typically ~5 yrs to develop a liquefaction project); this means good visibility of supply relative to demand across the next 5 years, but slow supply response to market price changes.
- There are very limited volumes of new supply set to enter the market until later in 2025 i.e. the LNG market remains strongly driven by demand until then.
- The surge in prices in 2021-22 has triggered a wave of new supply from 2025-29 (with flexible hub indexed US LNG and Qatari oil-indexed supply the dominant sources).
- The pace & scale of Asian demand growth is the key uncertain factor set to shape LNG market balance across this decade.
- European LNG demand has seen a major step up in response to Russian supply cuts, but is set to stabilise before declining into next decade as decarbonisation continues.
Let’s consider how this supply & demand balance picture may shape the next phases of market evolution.
Framing the next phases of market evolution
In Table 1 we draw on the supply & demand dynamics above to set out 3 potential phases of market evolution across the next 10 years.
Table 1: Next phases of LNG market evolution
The shape & timing of the phases of market evolution we set out above is set to drive market balance and pricing dynamics. To fully understand this it is important to analyse the ‘stack’ of market flexibility, from both the supply side (e.g. US shut ins) and the demand side (e.g. coal to gas switching, pipe vs LNG, oil switching, flat price induction vs destruction).
We come back next week with analysis using this stack approach to set out the evolution of LNG market pricing dynamics across the next 10 years.
Join our upcoming webinar
Title: “What next?” – a framework for analysing LNG market evolution & portfolio value drivers in a post-crisis world
Date: Wed 14th Jun 09:00 BST (10:00 CET, 16:00 SGT)
Registration link here, free to attend
Focus:
- Market regime framework for price evolution to 2035
- Downside risks e.g. 2023 and 2026-28 vs potential re-tightening e.g. 2024-25
- How marginal pricing dynamics are shifting post-crisis (e.g. JKM vs TTF vs DES NWE)
- Why price volatility is structurally increasing
- Implications of new market dynamics for LNG portfolio value (e.g. US tolls, regas, shipping)