What drives the pricing of gas at European hubs? Oil indexation, long term contracts, LNG flows, Russian supply, interconnection, swing, storage… or all of the above and more. This is a problem that asset owners, investors, traders and risk managers grapple with on a daily basis given its importance as a driver of asset and portfolio value. But understanding European hub pricing dynamics does not require terabytes of data and a super computer. At a basic level it is a problem that can be tackled in your head.
There are two important considerations that can greatly simplify hub price dynamics:
- Grouping sources of supply with similar pricing and flow dynamics
- Focusing on the flexible volumes of gas that drive hub pricing at the margin
The first of these tasks is helped by the fact that most sources of European supply are under long term contracts that use a similar structure. The second task is assisted by the fact that only a relatively small volume of total European supply actually has the flexibility to respond to changes in market price.
The traditional approach to analysing gas market pricing is to build a ‘bottom up’ view encompassing a detailed representation of fields, pipelines and contracts. In this article we challenge that approach. The growing complexity of interconnected gas markets is eroding its validity.
Instead we present an alternative framework for understand hub pricing. At its simplest level this can be used as a qualitative frame of reference – i.e. tackled in your head. Or it can be extended to numerical analysis with varying levels of complexity. But importantly there is no substantial time or cost hurdle in starting to apply the framework logic.
Where the traditional approach breaks down
The traditional view has been that complex modelling is required to do justice to an understanding of European gas pricing dynamics. A detailed view is required of the characteristics and costs of fields, contracts, import infrastructure, transmission, storage etc. This means lots of data and a large and complex model.
This bottom up supply and demand modelling approach works relatively well in power markets where price dynamics are primarily influenced by production costs. Transparent installed plant capacity and efficiency data combined with observable fuel costs mean developing a view of the power supply curve is relatively straightforward.
But the important difference with the European gas market is that most gas comes into Europe under long term contracts. So contractual pricing and flexibility are key drivers of physical flows and hub pricing dynamics. By contrast, contractual positions can largely be ignored in power market analysis where pricing dynamics are focused on variable production cost.
The traditional bottom up supply and demand analysis approach may have had its place when gas markets were relatively isolated (e.g. tackling the UK market on a standalone basis). But the European gas market is now a highly interconnected set of hubs across a complex range of physical infrastructure. Hubs are also increasingly influenced by global pricing dynamics. Trying to represent this complexity in a detailed bottom up model has two key flaws. The detail erodes transparency as to the real drivers of gas flows and pricing. And genuine insight is lost in the noise created by trying to capture the complexity of detail.
Grouping sources of European gas supply
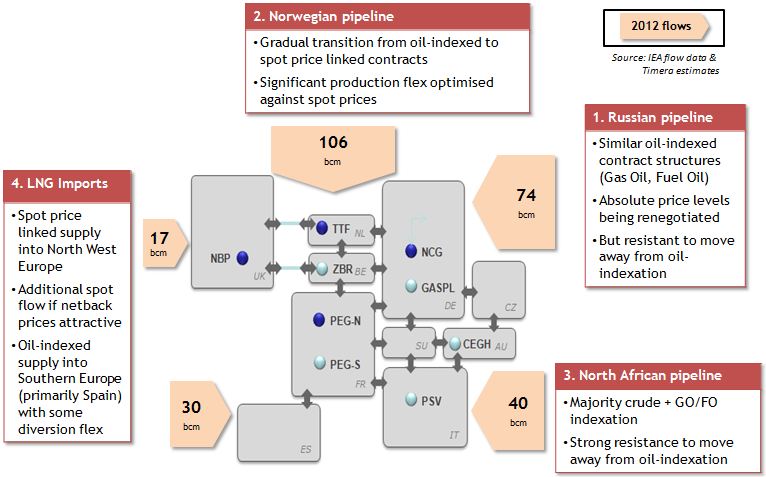
To understand hub pricing dynamics it helps to start by drawing a ring around the European countries that have direct access to hub liquidity. The boundaries of this ring are somewhat arbitrary depending on focus, but broadly include North West, Central and Southern Europe. Within this boundary, European gas supply can be grouped into several key sources by geography as illustrated in Diagram 1. The diagram illustrates volumes by supply source based on 2012 gas flows.
Diagram 1: Sources of European gas imports

Note: Diagram and gas flows based on a European hub zone boundary that covers UK, BE, NL, FR, DE, CZ, AU, CH, IT & ES.
The following is a brief summary of each source of supply:
- Russian supply – imported under long term supply contracts of a relatively consistent structure, incorporating (i) indexation to oil products (ii) with some volume flexibility but (iii) a take or pay constraint.
- Norwegian supply – which can be split into two components:
- Long term oil-indexed supply contracts (on a similar basis to Russian supply).
- Supply that flows based on spot price signals, incorporating (i) hub indexed supply contracts and (ii) uncontracted Norwegian production.
- North African supply – primarily import contracts into Italy and Spain on a similar pricing and flexibility basis to Russian gas (although with a greater influence of crude indexation and generally higher contract prices).
- LNG supply – which can be split into two components:
- Long term oil-indexed supply contracts (primarily into Southern Europe).
- Supply that flows based on spot price signals, incorporating (i) hub indexed supply contracts into North West Europe and (ii) global LNG spot market supply (i.e. cargoes that flow into Europe based on spot price signals).
- Domestic production – dominated by declining field production in the UK and Netherlands.
The other key supply dynamic that is not captured in these five categories is gas storage capacity. This is not to say storage should be ignored – it can in fact be a very important driver of hub pricing dynamics. But it makes more sense to think of storage capacity as enabling the movement of gas between time periods, rather than as an outright source of supply. Seasonal storage acts to move gas from lower priced summer periods to higher priced winter periods. Fast cycle storage acts in a similar fashion but over a short time horizon.
The geographical groupings of supply sources set out above are defined primarily on contractual rather than physical characteristics (although uncontracted sources are also captured). This enables a focus on the commercial decisions that drive the pricing and flow of gas, rather than trying to capture the detailed complexity of physical assets and infrastructure. The logic of these groupings will become clearer as we explore how flexibility drives pricing.
Types of supply: flexible vs inflexible
Gas supply volumes are either flexible or inflexible. Flexible supply can respond to changes in hub pricing, with flows based on the relationship between hub prices and contract prices (or an opportunity cost alternative in the case of storage). But the majority of European gas supply is inflexible, i.e. supply volumes are insensitive to changes in hub prices. This characteristic is key because it greatly simplifies the task of understanding hub price drivers.
Inflexible supply falls broadly into three categories that make up around 75% of European supply:
- Pipeline contract take or pay volumes – Virtually all long term pipeline supply contracts into Europe contain provisions where buyers must pay for gas volumes (typically 80 – 90% of annual contract quantity) regardless of whether gas is taken.
- Destination inflexible LNG contracts – Supply contracts into Southern Europe have traditionally had fixed destination clauses that prohibit the diversion of gas (although a number are being renegotiated).
- Domestic production – With the exception of a small number of fields, production within Europe is largely insensitive to price.
It is important to account for these inflexible volumes in developing an overall view of the supply & demand balance across Europe. These volumes will essentially flow regardless of the absolute hub price level (although several tranches are profiled within year and have an influence on seasonal price spreads). But in terms of understanding the drivers of hub pricing dynamics, inflexible volumes sit a long way down the list of priorities.
Much more important are the volumes of flexible supply that are responsive to price. These are summarised in the following table:
Hub prices move based on the changing intersection between demand and supply. Given demand is relatively insensitive to price, it is supply flexibility that plays the central role in determining how prices evolve at the margin. So a solid grasp of hub price dynamics can be built around an understanding how the different sources of flexible supply interact to drive marginal pricing.
In order to do this a view of the pricing of each flexible supply source is required. Although there are many individual supply contracts that determine this, the fact that each flexible supply source uses a similar pricing structure makes life easier. Price proxies can be developed relatively easily, for example for Russian, Norwegian and North African oil-indexed supply (see here for an explanation of how). Alternatively if you prefer to steer clear of spreadsheets, you can gain a reasonable understanding from forward market prices and published contract benchmarks, for example for the German border price of oil-indexed contract imports.
Pulling everything together
So far we have talked about (i) geographical groupings of supply and (ii) different types of flexible supply. The picture comes into focus when we combine these two views to define the main individual tranches of flexible gas supply. It is the commercial dynamics of these tranches that are the primary driver of hub pricing dynamics.
Of the flexible sources of supply, pipeline contract swing is of principle importance. Russian and Norwegian oil-indexed contracts are particularly important as a provider of swing flex into Germany. Utilisation of this swing flexibility tends to anchor European hub prices within a band around oil-indexed contract price levels.
This price band is somewhat flexible, but it is also resistant. It can be stretched by prevailing supply and demand dynamics, but the further prices deviate from oil-indexed benchmarks (e.g. the German border price), the stronger is the force acting to pull prices back. As hub prices fall below oil-indexed contract prices, contract owners utilise swing to pull back on contract volumes which supports hub prices. As hub prices rise above oil-indexed levels, swing gas flows increase acting as price resistance.
Norwegian uncontracted production flexibility also plays an important role. Norwegian flows are a key source of seasonal flexibility as well as an equalising force across hubs (given multiple delivery points across North West Europe). Norway also holds an important strategic card in being able to pull back on production to support hub prices in periods of oversupply.
Flexible and spot LNG supply is currently of less importance to European hub pricing. The prevailing structural Asian spot price premium means diversion flexibility is being fully utilised to send cargoes east. But with volatile spot prices, this situation can change at short notice e.g. the temporary LNG flows back into Europe in summer 2012.
Next week we apply the framework
The logic set out above describes the basic elements of a framework to understand European hub pricing. This is built around the interaction between the flexible tranches of supply that drive marginal pricing. At a summary level these are factors that you can grapple with in your head. If you want to dig deeper, a more dynamic representation of the framework can be developed in a spreadsheet relatively easily. We have taken it a step further again and developed a more detailed framework model, but this is no prerequisite.
Next week we focus on the more practical application of this framework, using examples to illustrate how tranches of flexible supply move hub prices. Importantly we also look at the strategic considerations of the key players with significant market power, the Russians, Norwegians and Qataris. To do this we develop a simple ‘supply stack’ view of European flexibility. We then use the framework and supply stack view to illustrate the commercial dynamics driving hub price evolution.

