European and Asian spot gas prices have halved across the last six months. European hub prices are currently testing the 5.0 $/mmbtu level, down from almost 10 $/mmbtu in late September 2018. The key JKM Asian price marker has converged towards TTF price support and is currently around 5.5 $/mmbtu.
This plunge in prices across the current winter, has the LNG market firmly focused on the near-term supply & demand balance. Debate is raging as to whether the current wave of new LNG supply (2016-21) is starting to outstrip demand growth.
In today’s article however, we are going to take a step back, look beyond the near term market balance and consider the potential timing and volume of a new wave of supply in the mid 2020s.
We have flagged several times that lower near term prices may increase the risk of a tightening LNG market in the early to mid 2020s. This is because there has been a relative hiatus of liquefaction project FIDs across the last three years. New projects take 4 to 5 years to deliver. That leaves a potential supply gap in the 2022-25 horizon if global demand growth remains strong.
But from the middle of next decade a new wave of supply is starting to take shape. 34 mtpa of new projects have now been FID’d across the last 12 months. And there is a much larger volume of credible supply options queueing behind this. We explore today what this next wave could look like.
Is this time ‘really different’?
The LNG sector is noted for its cyclicality of investment. Past LNG supply waves have been built on buyer’s anticipation of demand 4 to 5 years into the future. This has underpinned buyer willingness to sign long term contracts (mainly on an oil indexed or Henry Hub plus costs basis). Offtake contracts have then allowed project developers to secure non-recourse financing.
This time it is at least somewhat different:
- Asian buyers such as Japan, South Korea and Taiwan are uncertain of their future LNG requirements given risks around changing energy mix policies and in the case of Japan nuclear re-starts.
- India’s LNG requirements are difficult to gauge given the price sensitivity of its power generation and fertiliser sectors and the lack of a significant space-heating sector to underpin infrastructure extension.
- For Thailand, Pakistan and Bangladesh the uncertainty of indigenous production decline rates makes future LNG requirements difficult to judge.
For these reasons, China remains the key market where long term contracts for end use consumption appear most likely.
Enter the Portfolio Players
We have previously flagged that the next wave of new LNG supply will likely be dominated by gas majors (e.g. Shell, Exxon, Qatar & BP). Large trading functions and access to balance sheet financing give them a comparative advantage over independents who rely to a greater extent on non-recourse finance (and hence long term contracts).
This has been borne out across the last 6 months by the Shell Canada, BP Tortue and Exxon Golden Pass FID’s. Portfolio players have also facilitated the financing of LNG projects by signing up for the entire offtake of third party LNG projects (BP and the Mozambique Coral project and US Freeport train 2). The portfolio player ‘direct upstream financing’ and ‘large offtake agreement’ model is supporting new LNG upstream FIDs in a period of uncertain Asian LNG demand growth.
There is still space for some ‘traditional model’ projects, where buyers underwrite supply with long term contracts. But the timing and volumes of supply in the next wave will be driven to a greater extent by the gas major’s assessment of supply and demand balance from the mid 2020s. If the majors think the market will hold new supply then they will pull the FID trigger.
What could the next wave look like?
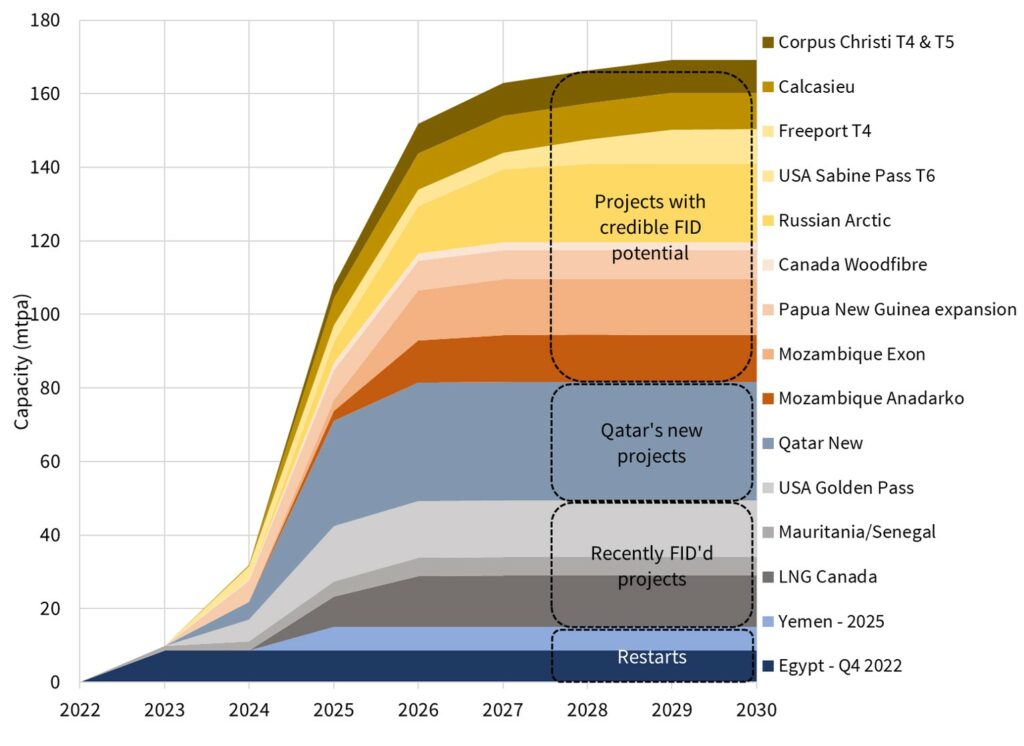
Chart 1 illustrates a build-up of credible sources of new supply that could contribute to the next wave. These are split between:
- Restarts of existing liquefaction (Egypt, Yemen)
- Recently FID’d projects
- Qatar’s new trains – not yet formally FID’d but compelling economics
- Additional projects with credible FID potential
It is important to note that the chart does not represent a projection of anticipated volume ramp up timing. This is something that will start to become clearer as FIDs are taken and construction commences. The chart is instead illustrating when new project volumes could credibly come online given existing and potential FID dates.

