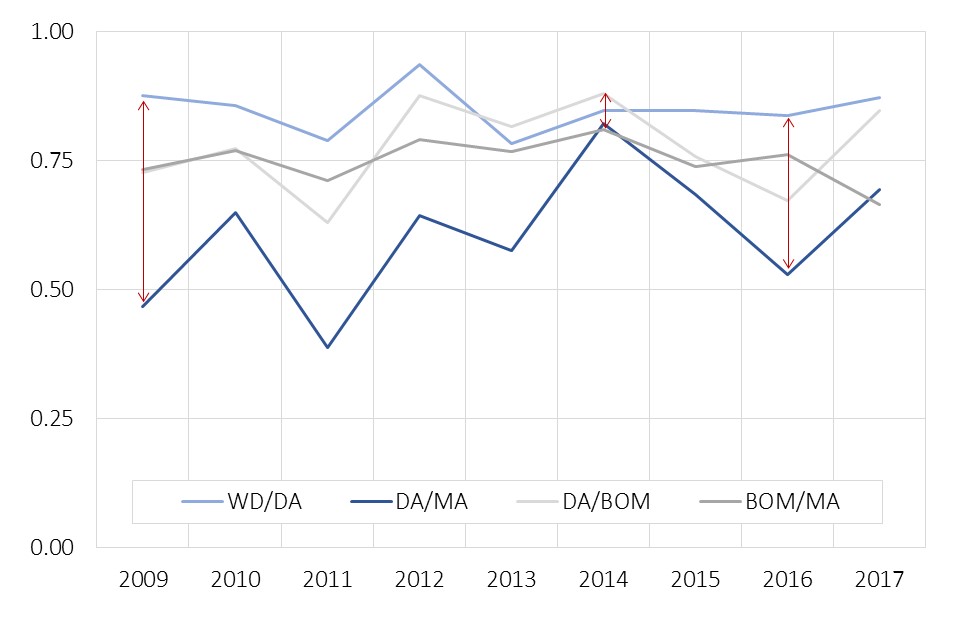
Gas storage value is underpinned by an ability to shift gas from lower to higher priced periods. Differences in the value of gas across time periods are commonly referred to as time spreads.
Capacity owners focus on two key market price signals for time spread behaviour:
- Summer/winter price spreads drive the value from seasonal profiling of inventory.
- Spot price volatility drives the value of shorter term injection and withdrawal decisions.
But there is a third value driver, forward price correlation, which gets less attention than it deserves.
The correlation of forward gas price movements determines the value that can be created from hedging storage capacity. If forward prices move up and down in unison, forward hedging opportunities are limited. But as price correlations break down, the value that can be generated from hedging storage in the forward market rises.
The two primary storage hedging strategies
Storage traders use two basic strategies to monetise capacity value:
- Spot based strategies: The focus here is on a single decision: to injection, withdraw or do nothing (if variable costs cannot be covered). This decision is based on how the current spot price compares to the assumed behaviour of future spot prices. As such, it is an approach that relies on probabilistic modelling of spot price behaviour.
- Spread strategies: The focus here is on hedging observable time spreads (or price differences) across forward market contracts. Adjustments can then be made as time spreads evolve and new contracts become available (e.g. via a rolling intrinsic strategy). At any point in time the intended injection and withdrawal profile are covered by hedges.
Traders like spread based strategies because they provide access to extrinsic value, while significantly reducing risk (because they are essentially arbitrage trades). At any point in time storage inventory is not exposed to sharp changes in absolute gas price.
Traders also like the possibility of trading profitable spreads in volumes equivalent to the full capacity of the facility over the tenor of the forward contracts involved (e.g. one month), as compared with spot trades that are often only for a single day’s injection / withdrawal amount.
In practice, most storage traders will operate a hybrid strategy (a combination of spot + spread) overlaying market views and personal judgement.
Why price correlation matters
The behaviour of forward market time spreads is the key driver of spread based strategies. Traders generate margin via the placement and adjustment of forward hedges. The amount of margin achieved is a function of both price volatility and the correlation between contract prices. For example if two contracts are very volatile but perfectly correlated, there will be no change in the underlying spread.
In less mature forward markets, price correlations across different contracts tend to be very highly correlated. This is because forward curve movements are heavily influenced by movements in the spot price (‘prompt wagging the curve’).
In more mature markets (such as NBP and TTF), correlations can break down as different contract periods are influenced by unique supply and demand dynamics. For example, a forecast for a blast of cold weather over the next three days has little impact on the price of gas for next month. Similarly announcement of dates for a maintenance outage on a key import pipeline will typically impact forward prices around those dates, but have little impact on other forward prices.
UK price correlation is declining
In order to illustrate the importance of price correlation we look at a UK gas market case study. The logic is also directly applicable to Continental hubs (e.g. TTF & NCG).
In table 1 we show an analysis of the correlation of prompt NBP contacts. These are particularly important as a driver of fast cycle storage capacity value.


