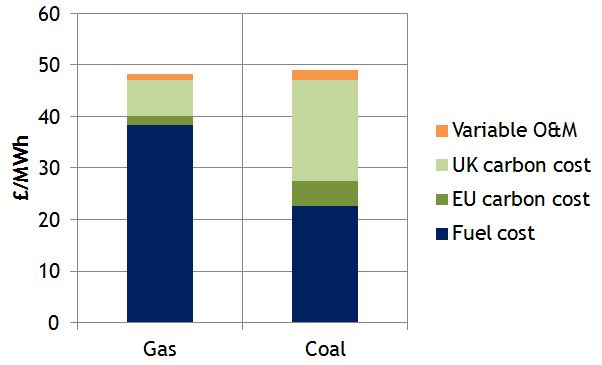
The UK carbon price floor is driving a wedge between the UK and European cost of carbon. This will have an important impact on the competitiveness of gas vs coal generation in the UK. Indicative forward market pricing suggests that gas plant may start to displace coal plant by the summer of 2016. This has interesting implications for UK power price dynamics and generation returns.
Intervention to support the UK carbon price is one of the four pillars of the UK government’s EMR policy. This is to be achieved via a tax funded top up premium that will increase the price of UK carbon above that of the EU ETS market price. With the government publishing its intended carbon support levels out to 2016 in this year’s budget, we can start to get a clearer idea of the implications for the UK power market.
Gas vs coal plant competitiveness
The carbon intensity of electricity generation from a coal plant (around 0.9 t/MWh) is more than double that of a gas-fired CCGT plant (around 0.4 t/MWh). So the carbon price floor acts to increase the variable cost of coal generation relative to gas. This impact is currently relatively small given the current carbon support premium of around 5 £/t on top of the EUA price (currently around 4 £/t).
But by 2016, the UK government intends to add a 21 £/t premium to the carbon EUA price. A premium of this size will have a significant impact on gas vs coal plant competitiveness as illustrated in Chart 1.
The chart shows the short run marginal cost (SRMC) of a new CCGT (54% HHV efficiency) versus an average UK coal plant (36% efficiency). Fuel and carbon costs are based on indicative forward pricing for gas, coal and carbon for summer 2016. On a variable fuel cost basis, coal generation is still much cheaper than gas. But the government’s carbon price support means the cost of carbon starts to tip the competitive balance in favour of gas plant.
Another factor behind the forward market anticipated change in gas vs coal SRMC, is the shape of fuel forward curves. The coal price curve is in relatively steep contango (prices rising over time). The NBP gas forward curve on the other hand is in backwardation, consistent with falling forward prices in the Brent curve. So although liquidity is poor out along the curve, forward markets suggest a narrowing in the fuel cost premium of gas over coal.
Power market impact
Closing the gap between gas and coal plant competitiveness has an important impact on UK power market returns and pricing dynamics. Two important implications of the government’s carbon price support are:
- Increasing the cost of carbon is acting to flatten the UK supply curve over time. As gas and coal plant competitiveness reconnects, there is around 40GW of CCGT and coal capacity with a similar variable cost.
- Relatively small shifts in commodity prices may cause significant changes in gas and coal plant load factors.
Chart 2 illustrates our net supply curve view of the UK power market based on Summer 2016 indicative forward prices and the government’s published carbon support premium. The flattening of the supply curve is clear. It can also be seen that at these price levels, the newest CCGT plants start to displace older coal plant.
The importance of the dynamics illustrated in the chart is their impact rather than their timing. Alternative pricing outcomes and coal plant efficiency upgrades may delay the switching of gas for coal beyond 2016. There is also a risk that the government revises down its carbon price support levels, particularly given the design of the mechanism has a number of flaws.
But as long as the government’s carbon price support remains in place, it will act to flatten the supply curve and increase the competitiveness of gas plant relative to coal. This will tend to dampen UK power price volatility and increase CCGT load factors. It may also impact the correlation between gas (vs coal) and power prices, as marginal price setting shifts between fuel types.
But higher CCGT load factors will not necessarily translate into a recovery in generation margins. The flat supply curve also reduces the rents that conventional generation assets earn when higher cost plants are setting the market price. The key to higher gas plant generation margins is a tightening in the market capacity margin. As plant closures and mothballing continue over the next 2 to 3 years this will act to increase marginal pricing in periods of high net system demand (high load, low wind). It is the increase in power prices and volatility over these periods that will be a critical driver of a recovery in generation margins.


