Three structural drivers are tightening the gas flexibility balance across Europe:
- Rising import dependency: resulting in a reliance on longer & less flexible supply chains (e.g. LNG, Russian pipeline gas)
- Power sector transition: with rising renewable intermittency and the closure of nuclear & coal plants increasing the role of gas-fired power plants in providing flexible generation
- Ageing infrastructure: investment in new flexible midstream gas assets has ground to a halt over the last 5 years, with owners ‘sweating’ existing assets.
In today’s article we set out clear evidence of a recovery in gas flexibility price signals across 2018-19. We also show ‘backtesting’ analysis that illustrates how price signal recovery is translating into higher value capture from storage capacity.
Price signals recover… at last
The value of gas flexibility (e.g. from storage, production & pipeline flex & regas) is driven by two key market price signals:
- Spot price volatility drives the value of deliverability (i.e. flexibility response near to delivery)
- Seasonal price spreads drive the value of seasonal flexibility.
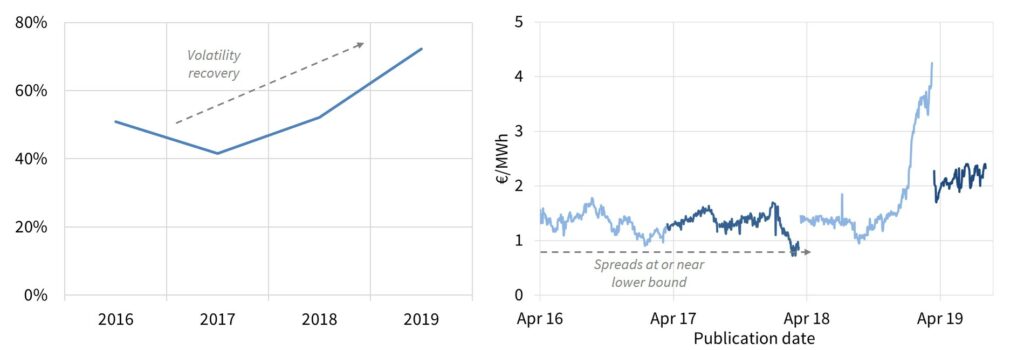
Chart 1 shows the evolution of these two price signals since 2016 at Europe’s core TTF hub.
Chart 1: Evolution of day-ahead TTF volatility (left) & front year seasonal spreads (2016-19)

Source: Timera Energy, ICE data
The left panel of the chart shows a clear recovery trend in TTF spot volatility since 2017. Volatility has averaged above 70% so far in 2019 (& is currently above 100% on a 30 day rolling basis). It is interesting to note that this rise in volatility is happening against the backdrop of a well supplied gas market and lower prices. A key driver of higher volatility over the last 12 months has been the role Europe has been playing in absorbing surplus LNG cargoes to balance the global market.
The right panel of Chart 1 shows the forward TTF summer/winter spread as it evolves in the lead up to each storage year (Apr to Mar). A rise in seasonal spreads can arise from three situations: (i) an increase in winter prices, (ii) a fall in summer prices and (iii) both of these factors combined.
Fears around winter tightness are the most common cause of rising spreads. But in 2019 the focus has been on summer price weakness, given a requirement to clear high volumes of LNG imports. This caused the Sum-19 / Win-19 spread to surge across Q1 2019. And the recovery in spreads has also fed through into Sum-20 / Win-20 price spreads, which are around 2.3 €/MWh, almost double the levels of last year.
It is worth noting that price signal recovery at the UK NBP has been sharper given the impact of the retirement of Rough storage in 2016.
Storage margins follow suit
It is no surprise that price signal recovery has translated into higher potential returns for storage capacity holders. Although the level of storage margin capture for any given capacity owner depends factors such as inventory levels and forward hedge positions.
In order to provide a simple benchmark on value recovery we have ‘backtested’ margin capture for a generic fast cycle (60 day cycle) and seasonal (180 day cycle) storage asset. The results across each of the last 4 storage years are shown in Chart 2.
We use our in-house storage modelling framework to do this, applying a commonly used rolling intrinsic trading strategy. This involves analysis of margin capture from actual (or ‘outturn’) market price movements where hedges are adjusted against available forward contract prices as these evolve.
Fast cycle margins have recovered by a proportionally higher amount than seasonal asset margins. This reflects the leveraged exposure of fast cycle assets to the recovery in volatility. But there has also been a significant increase in seasonal asset value capture across the last two years, as both volatility and spread recovery lifts returns
Who will benefit from value recovery?
In the short term, the benefits of rising storage margins have been skewed towards capacity buyers e.g. trading desks. This is because buyers have bought storage capacity from asset owners at price levels that reflect the weaker market conditions that preceded the recent price signal recovery.
A continuation in storage value recovery should increasingly flow through to asset owners (vs buyers). This is because increasing volumes of storage capacity are being sold on an annual (or shorter term) basis, as long term contracts roll off and are not renewed.
However the ability of storage owners to maximise value capture depends strongly on capacity sales strategy, contract structures and business model. We explore these factors alongside drivers of continuing storage value recovery in a recent briefing pack (link below).
Briefing pack: European Gas Storage Value
Sep 2019 Timera briefing pack on gas storage margin recovery, market drivers & commercial implications.: Gas storage value recovery |


