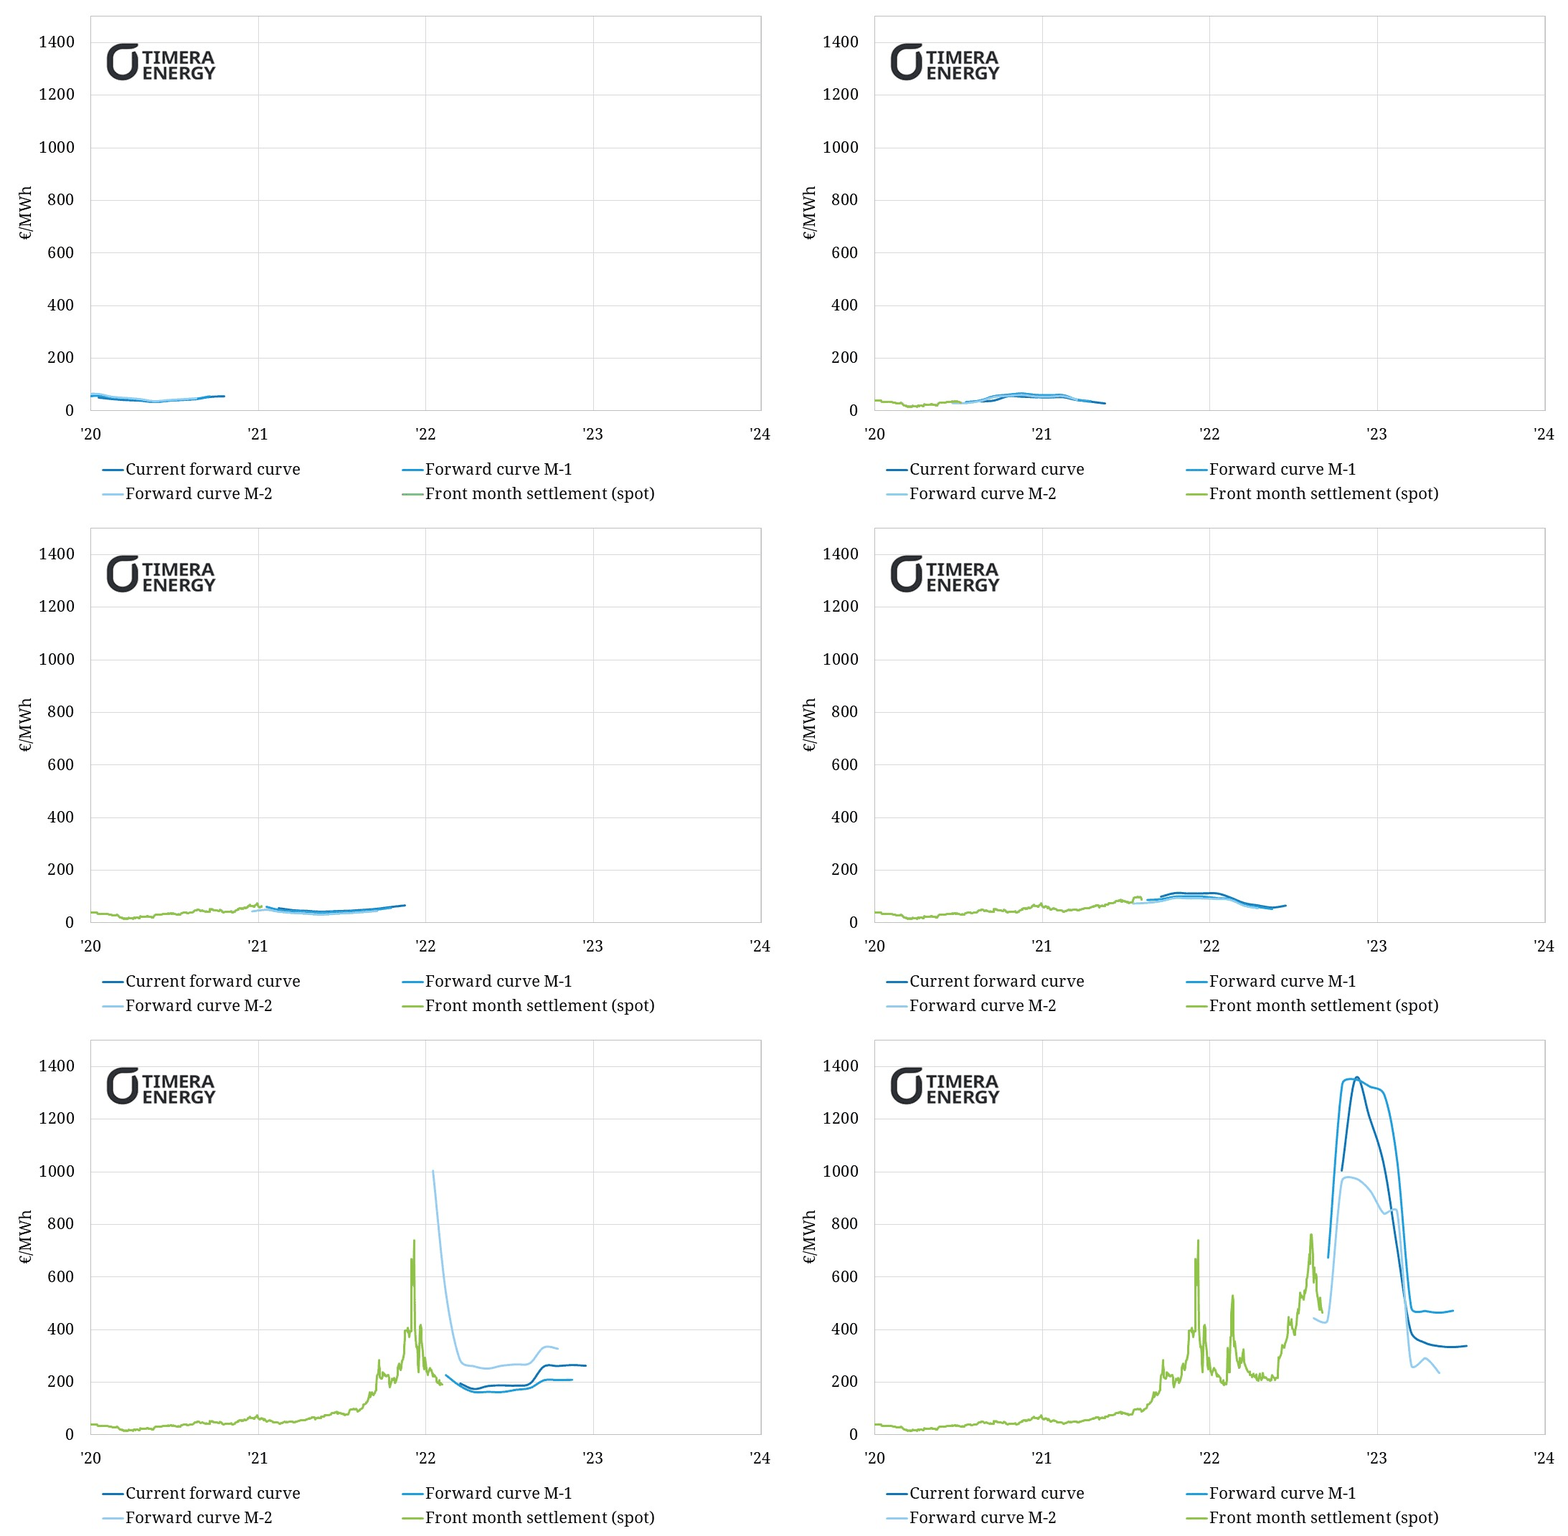
The following animation of French baseload price evolution needs no introduction. It records what will go down in the records as one of the greatest bouts of commodity price volatility in history.
“The French power market is at the epicentre of Europe’s energy crisis”
We have slowed the animation down from Q3 2021 given the ferocity of price moves.
Chart 1: Evolution of French month-ahead baseload power prices & forward curve

Source: ICE, Timera Energy
Let’s consider 3 takeaways from the animation.
1. Price spike to dwarf all spikes
Europe is at the epicentre of a global energy crisis. The French power market is at the epicentre of Europe’s energy crisis.
The animation puts the scale of the French power market stress across 2021-22 in perspective. Market stress has been an ongoing reality since summer 2021, but the crisis is defined by two major spike events.
Q4 2021 spike: The animation shows the first leg of this crisis in late 2021. The primary driver of this initial spike was surging gas prices feeding through into marginal power prices. This caused an approximately ‘12 x’ spike in baseload prices vs long run average levels (with front month prices above 700 €/MWh).
Q3 2022 spike: The second major stress event in Jul & Aug 2022 saw prices for the coming winter decouple from gas, with French prices surging to more than ‘20 x’ long run average prices (with winter 2022 prices above 1300 €/MWh).
If you find it hard to think in €/MWh terms, this second spike is the equivalent of well over 1000 $/bbl oil price equivalent. That is why increasing evidence is emerging of widespread industrial demand destruction since the latest price surge this summer.
2. European dependence on French nukes
Europe’s power crisis has been somewhat overshadowed by the geopolitically dominant Russian gas supply crisis. 2022 is demonstrating that as well as cheap Russian gas, Europe’s economy depends on low variable cost French nuclear power.
France’s 10 year average nuclear fleet generation output is around 400 TWh. EDF’s latest guidance for 2022 output is 280-300 TWh. So Europe is likely facing a deficit of more than 100TWh of nuclear power (vs average output).
This is not a one year problem. Ongoing availability issues have led EDF to downgrade 2023 output guidance to 300-330 TWh. Regular downward revisions across the last two years have seen the market increasingly treating French nuclear availability issues as structural rather than temporary.
Nuclear is the EU’s single largest source of power generation (731 TWh in 2021 vs 550 TWh gas, 386 TWh wind, 370 TWh hydro & 186 TWh solar). Reduced French nuclear output in 2022 is likely to represent a 13-15% reduction in total EU nuclear output in a what is also a year of record low hydro output.
The animation shows French power prices but these generation shortfalls are a pan-European problem, exacerbated by accelerating closures of thermal plants.
3. Price stress has transitioned into the forward market
We described two distinct phases of the crisis above (Q4 2021 vs Q3 2022). The animation shows another interesting shift between these two phases.
Through 2021 and early 2022, spot prices are leading forward prices. As spot prices surge the power forward curve remains in steep backwardation as the market is pricing power for future delivery at a discount to spot. This was consistent with the shape of the TTF gas curve (which was driving marginal power prices).
From Q2 2022 this dynamic changed. The crisis transitioned from an event focused on 2022 to one impacting the next 2 – 3 years. Forward power and gas prices surged across 2023-25. Power forward curves for the coming winter also surged to a large premium to spot as the market anticipated the risk of acute stress.
Since the EU announced its intention to intervene in late Aug 2022, forward power prices have fallen 40-50%. Much of this market reaction has been driven by anticipation of a structured framework for reducing or rationing demand in case of a cold winter. This has eroded the extreme risk premium that was driven into forward markets across the summer.
But a major misconception remains. European power prices this winter (& next) are not pricing off gas curves. This is evidenced by record high levels of forward winter spark spreads i.e. power prices are at a substantial premium over gas plant variable costs.
Since the latest phase of the crisis, it is the marginal cost of demand destruction that is setting power prices across Europe. As long as this remains the case it is reasonable to expect very high levels of power price volatility to continue. Demand is inherently less price responsive than supply.

