Europe is now facing a parallel gas & power crisis. The influence of the rising cost of gas driving up power prices is well understood. What is receiving less attention is a rapidly accelerating power crisis which is driving a renewed surge in gas prices.
“Power price rises are now materially outstripping gas”
The geopolitics of Russian supply dynamics is currently dominating global headlines. The current conflict has exposed the extent of Europe’s dependence on cheap hydrocarbons from a hostile neighbour. Russia cutting supply to Europe has been the primary driver of the surge in gas prices across Europe in H1 2022.
Europe’s parallel power crisis has gathered pace across the summer. This is being driven by nuclear availability issues, depleted hydro levels & declining thermal output (both due to fuel access issues & plant closures). Power prices across Europe are surging to record levels, now materially outstripping the rise in gas prices.
The price of TTF gas for 2023 delivery closed last week above 237 €/MWh (70 $/mmbtu), up 120% since the beginning of July! Power prices rises across the same period were much more aggressive. We’ve run out of adjectives to describe the pace of this price surge.
Acute power market tightness across Europe has been a key factor dragging up forward gas prices across the last 6 weeks. Europe needs more generation output to keep the lights on and the only remaining option is gas.
In today’s article we look at the circular pricing dynamics that are driving an upwards spiral of demand destruction in European gas & power prices.
Forward gas curve surge
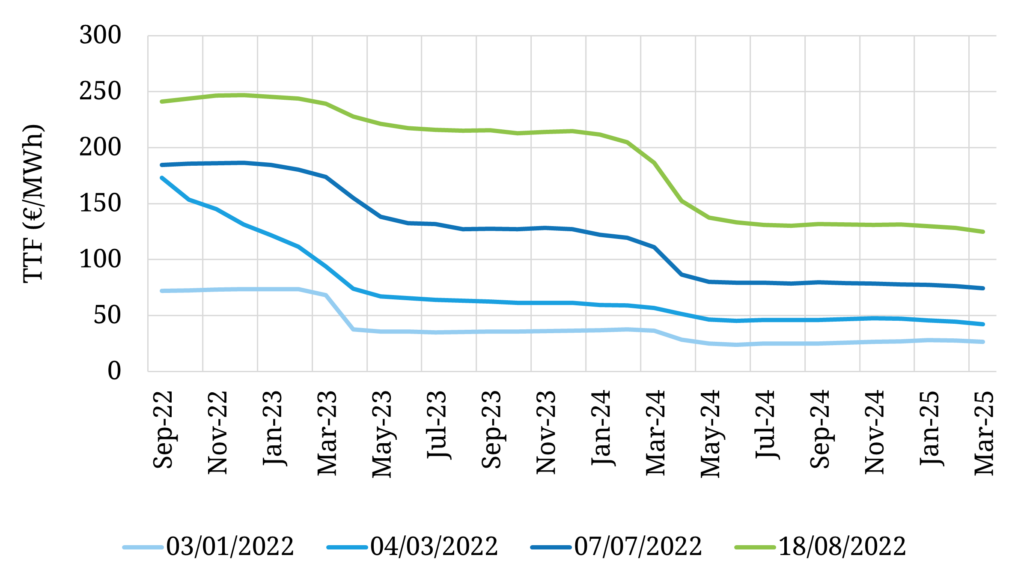
We rarely publish the same chart in consecutive feature articles. However to emphasise the scale of the move up in gas prices across the summer, Chart 1 is an update of the chart we showed in July.
Chart 1: The surge in TTF forward prices since early July

Source: Timera Energy, ICE
There is a lot of media attention on the front of the TTF curve. Prices for Sep 22 delivery are up around 35% since we published this chart (green line vs dark blue line).
Of far greater consequence is the fact that the price for delivery of gas across Calendar 2023 has risen 120% since the start of July. A pause to let that sink in… the already extremely elevated price for delivery of gas next year has more than doubled in the last 6 weeks. And it is the same for Calendar 2024 (also more than doubled).
These are seismic shifts in the energy cost base of the European economy. They point to impending broad-based industrial demand destruction and a substantial increase in the probability of administered gas rationing.
Europe’s growing power crisis
The primary factor driving rising European power prices across the first half of 2022 has been the surge in gas prices. CCGTs dominate marginal power price setting across European power markets. As a result gas price rises flow directly into higher power prices.
A separate European power crisis has been gathering steam into the summer. The drivers of behind this are:
- Very low French nuclear availability (EDF recently scaled back its output guidance for 2023 to 300-330TWh and is now facing cooling issues that are impacting an already weak 2022 availability)
- Historically low hydro storage levels from Scandinavia to Iberia (given widespread drought conditions)
- Thermal plant closures across Western Europe (across ageing coal, nuclear & gas plants)
- Fuel supply logistics driven by a combination of very low Rhine water levels (e.g. impacting barge coal delivery to German power stations) & logistical issues driven by the Russian conflict
- Periods of low wind & solar output where the factors above are driving a deficit in residual generation.
The combination of these factors is pushing the power crisis onto centre stage.
Power crisis now driving the gas crisis
Europe is short molecules of gas across the next 3 years. Given lack of any material supply response across this period (in the absence of a return to higher Russian flows), there are three demand side reduction options to balance the market:
- Industrial demand (already facing destruction of ~15% so far in 2022 due to higher prices)
- Power sector demand
- Residential & commercial demand (the sector that governments are most likely to try and protect in case of rationing).
Normally very high gas prices would incentivise reduced demand from the power sector. But going forward Europe is now short electrons as well a molecules. And the marginal source of incremental electrons comes from burning molecules.
In other words in order to keep the lights on, Europe has no alternative but to burn more gas, aside from intervention to reduce power demand which may also be coming.
A barometer for power vs gas crisis impact
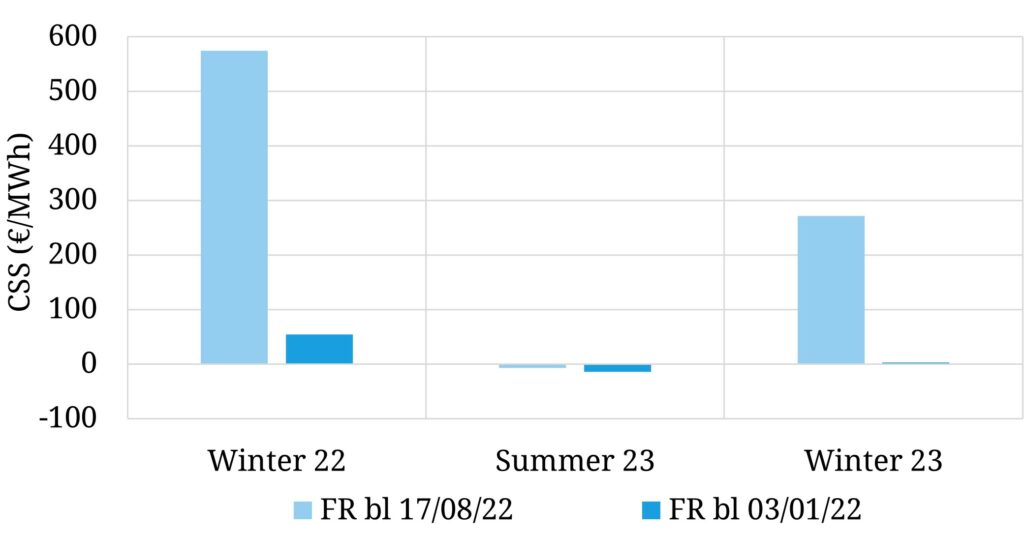
The market pricing barometer that best reflects the severity of the power vs gas crisis is the Clean Spark Spread (CSS). This is the spread between power prices and the variable generation cost of CCGT plants (i.e. CCGT generation margins). Chart 2 shows how much French CSS has exploded since the start of 2022 (much of this in recent weeks).
Chart 2: French forward Baseload CSS in Jan 22 vs Aug 22

Source: Timera Energy, ICE
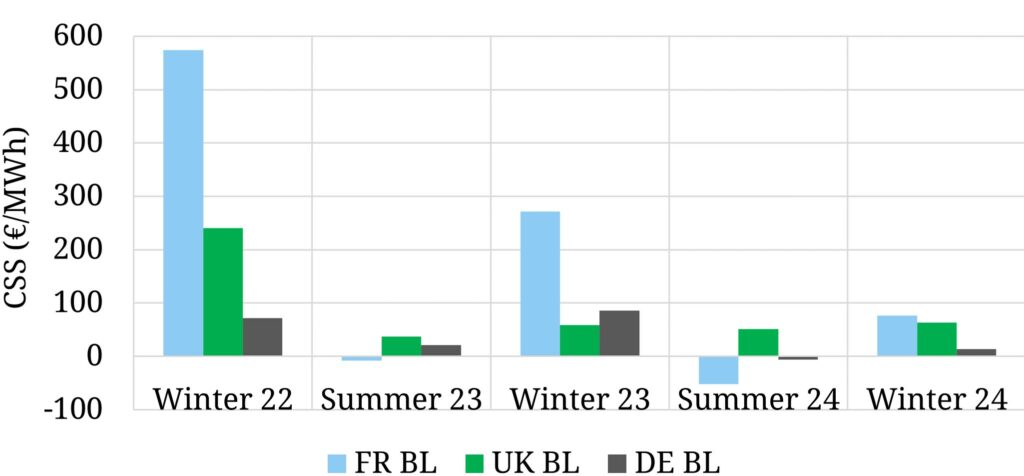
If CSS is rising it means that power price increases are outstripping the cost pass through of rising gas prices. This has been happening in spades this summer. It is most acute in the French market but forward CSS is also surging to record levels across most European markets. Chart 3 shows CSS in France versus two other key markets: UK & Germany.
Chart 2: Forward Baseload CSS in France vs UK vs Germany (18Aug22)

Source: Timera Energy, ICE
The UK & German forward CSS levels may look small relative to the French ones. Don’t be fooled… these are also at record levels. For example German Baseload CSS typically ranges from negative levels to low single digits vs more than 80 €/MWh currently for Winter 2023.
CSS transmission and the liquidity challenge
Forward CSS is a key transmission mechanism that is seeing rising power prices drag up the TTF gas curve. As forward CSS surges, it increases the incentive for gas generators to hedge forward generation. This involves forward selling of power and buying of gas (& carbon).
In other words entirely rational generation hedging is bidding up the cost of forward gas in response to higher power prices (& CSS).
Movements in both gas & power prices are currently being exacerbated by very poor market liquidity. This is a function of:
- Margin & collateral issues which are constraining the ability of market players to trade forward
- Risk capacity (e.g. VaR / limit) issues limiting forward exposures.
In a market with bids spiralling higher, there is very little offer liquidity to dampen price rises. These conditions are set to continue to support extreme price volatility. Market moves are not only in one direction. For example any increase in Russian supply would likely cause forward markets to gap lower.
One key piece of information the market is searching for is some clarity on the structure of policy intervention e.g. in the form of rationing or auctioning industrial volumes. This information is a key input into trying to quantify the volumes & pricing of required demand destruction to clear markets.
A significant portion of current forward power & gas price levels is driven by risk premium reflecting this uncertainty. Markets are used to pricing electrons & molecules based on supply side flexibility, not demand side destruction & intervention.
Extreme prices create extreme incentives for all energy consumers to cut demand. Whatever form rationing takes, let’s hope it embraces market price signals rather than trying to dampen or cancel them.
Leave the crisis alone!
Next week we’re going to park our coverage of energy crisis dynamics and focus on something more uplifting. Current events are creating huge tailwinds for investment in battery storage across Europe. Our next article contains an assessment of the European battery investment landscape including a ranking of the opportunities across different markets.


