“Intraday power price shape is reshaping flex asset value”
Intraday price shape is a key price signal for power asset flexibility value capture. Price shape underpins the investment case for BESS, peakers and LDES assets (e.g. pump hydro & longer duration storage).
Plenty of material is published on the historical behaviour of power price shape. However this is of limited use for investors given the impact on price shape of structural changes in capacity mix and demand.
Today we set out modelling analysis of the forward evolution of price shape from our recently upgraded stochastic European power market model. We take the GB power market as a case study but many takeaways are relevant for other markets across Europe.
Choosing the right weapon for the battle
Power market models have become commoditised. They have become cheaper & easier to access, with colourful outputs and greater user control. But most models still use deterministic stack modelling methodologies that have not evolved much over the last 20 years.
The problem for flex asset investors & owners is that these deterministic market models are of little use for flexible power asset valuation. Why? Because they fail to capture the impact of structural market shifts that drive the pricing dynamics that underpin flex asset value e.g.
- RES (wind & solar) output uncertainty and forecast error
- Commodity price uncertainty & volatility
- Dynamic response of new forms of flexible technology such as BESS, LDES & demand flex.
Capturing these dynamics requires stochastic market modeling. And techniques here are evolving fast to ensure more accurate & transparent modeling outputs to support commercial decision making.
We have recently invested in a major upgrade to our power market modelling framework to enhance our stochastic modeling in order to better tackle some of these challenges. This is the first of several articles we will be publishing to show some of the outputs.
These model upgrades allow us to create a deeper link to underlying fundamental drivers of key short term price signals e.g. within day price shape, price volatility and the evolution these across the key markets in which flex assets can monetise value (e.g. day-ahead, intraday & balancing).
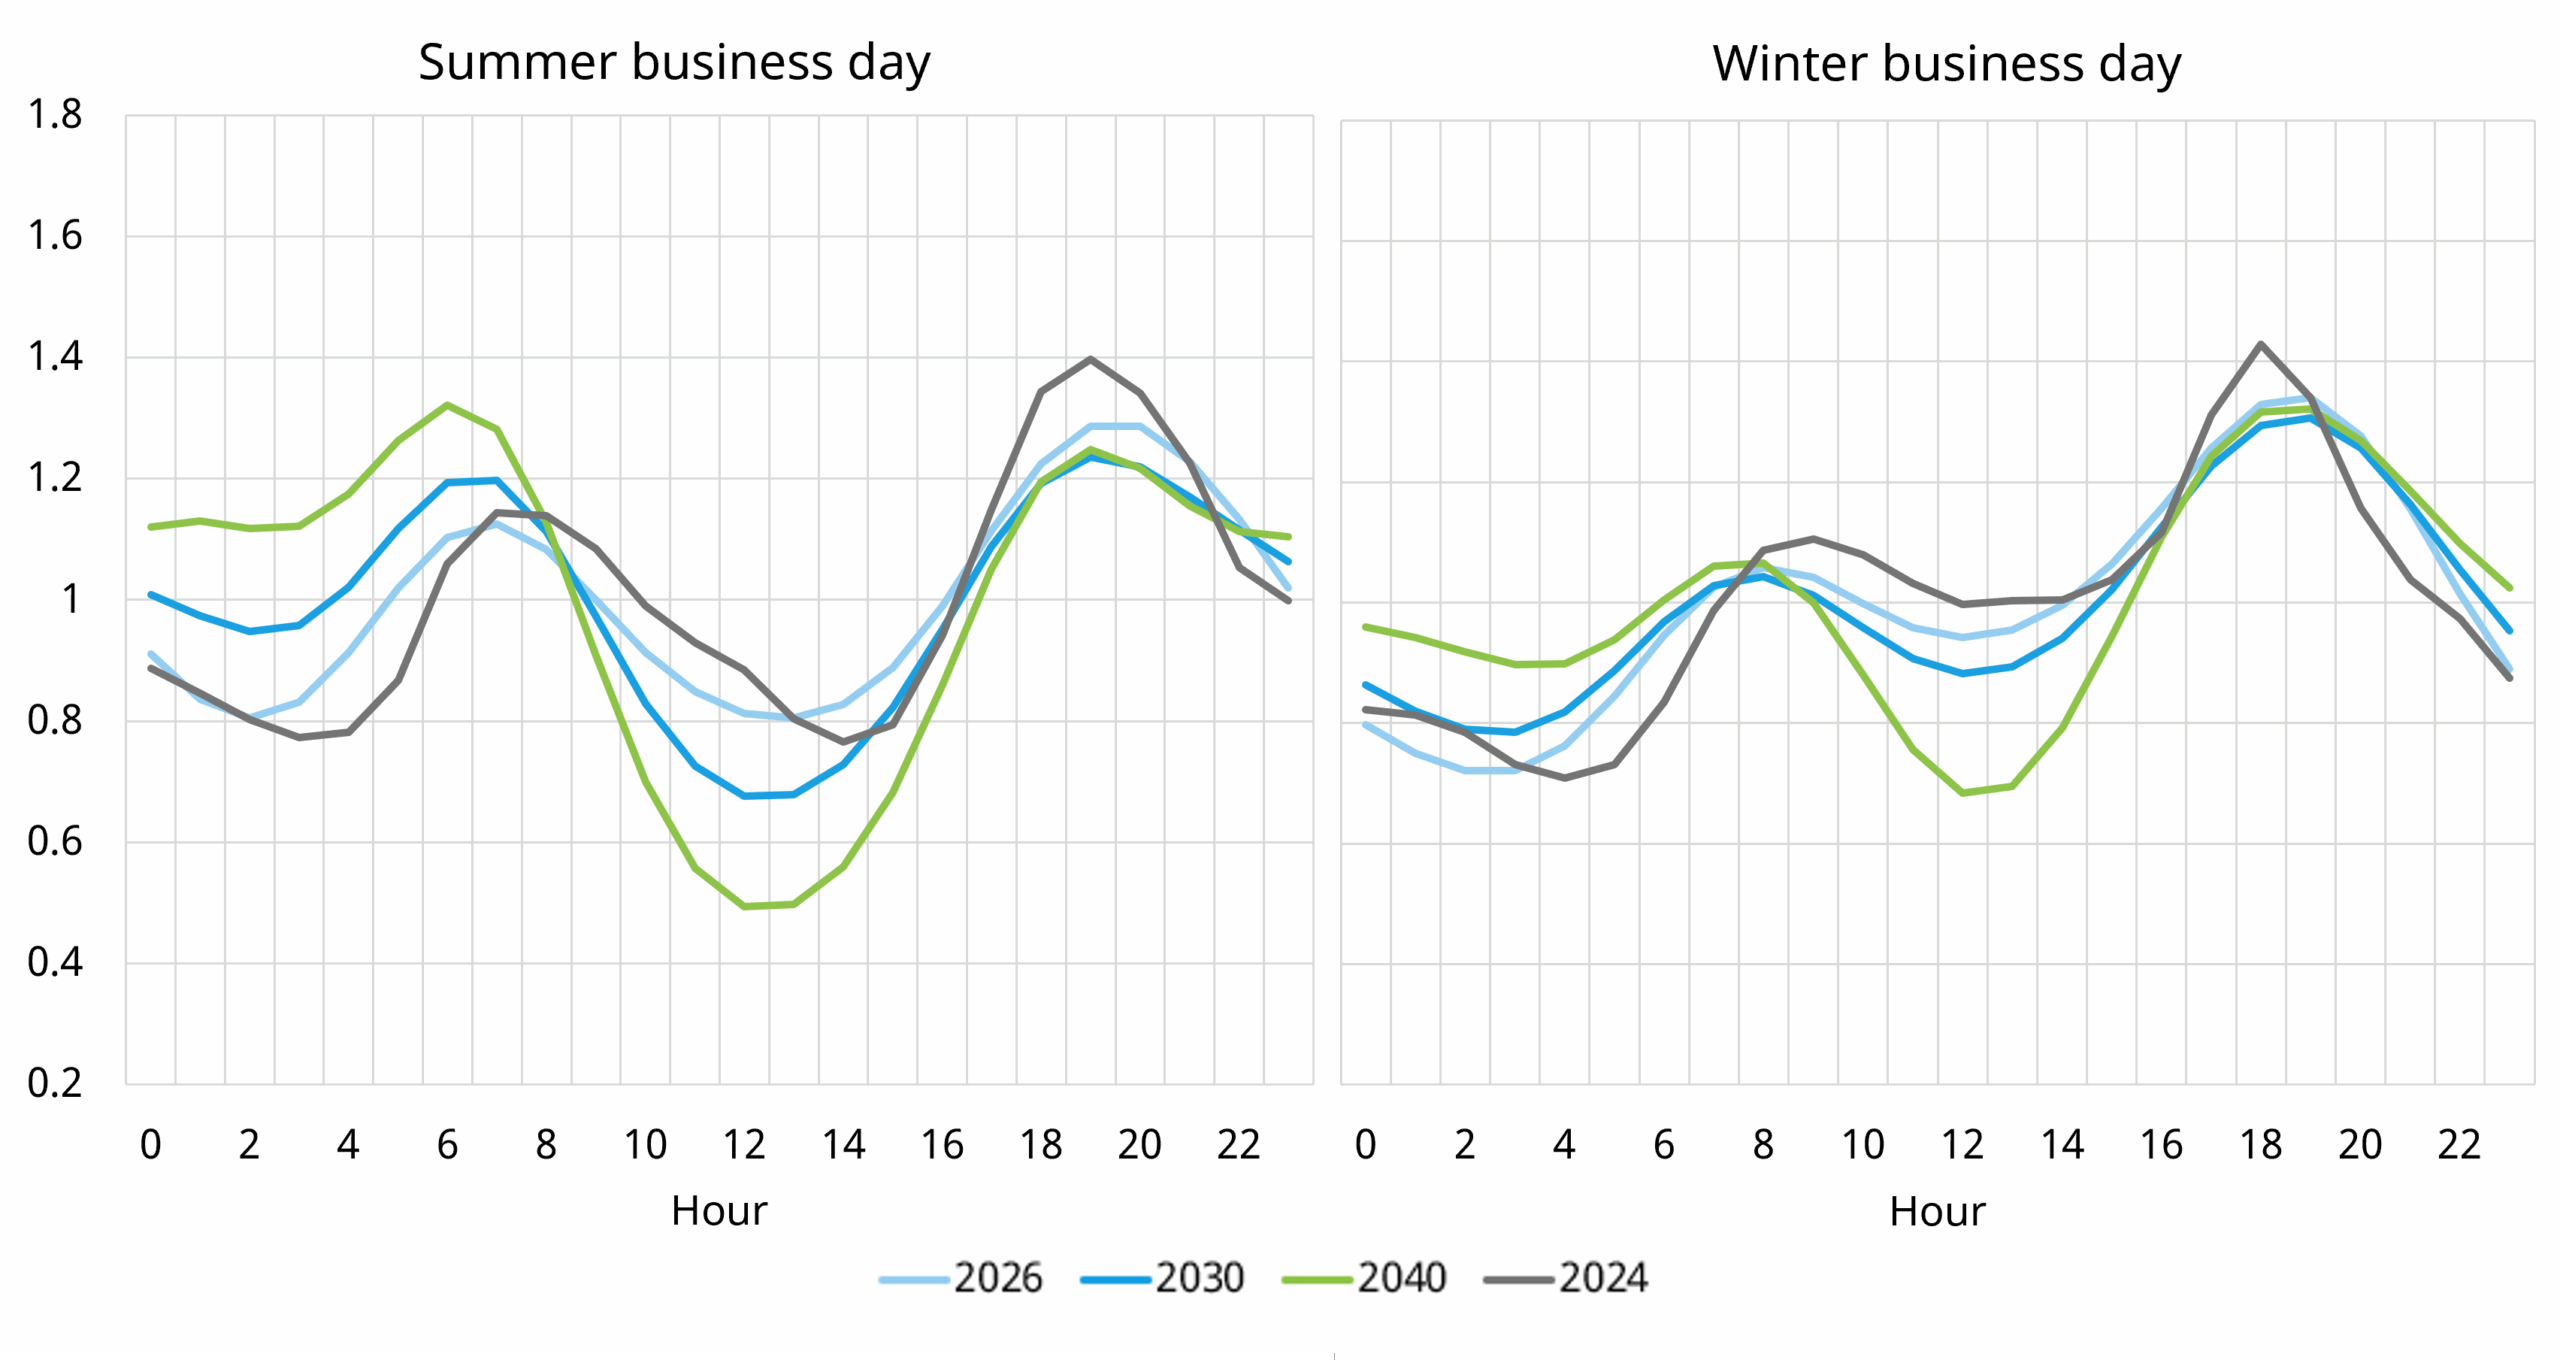
GB market price shape evolution case study
Chart 1 compares historic day-ahead price shape (from 2024) to an illustrative scenario projection of price shape evolution from our new stochastic market model for 2026, 2030 and 2040. The left hand panel shows Summer business days, the right hand panel Winter.