Off-piste descent for gas prices
TTF prices fell by more than 50% across Winter 2018-19. No… that is not an April Fool’s joke. The decline in European and Asian gas prices across the last six months has been steep and relentless.
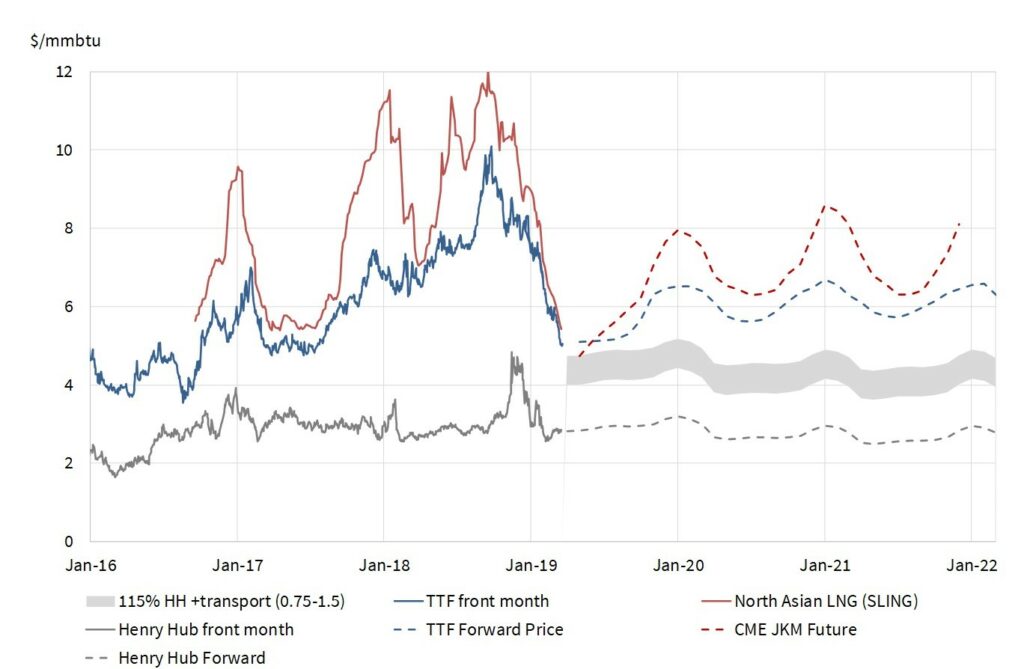
The price decline gathered pace in Q1 2019 as shown in Chart 1. As the quarter progressed, Asian spot LNG prices converged with European hub prices. Then in late March, the key North Asian LNG price marker JKM crashed through the TTF price level.
If the Q1 2019 price decline were a ski slope it would be marked with double black diamonds.
Price behaviour is consistent with an acute near term surplus of LNG into the start of summer. The growth in new LNG supply (e.g. from projects in Australia, Russia and the US) is at least temporarily outpacing demand growth.
The LNG market is clearing surplus cargoes via sending them to liquid north west European hubs. The discount of JKM to TTF reflects this dynamic, although liquidity in spot cargoes has been limited across recent weeks. At current prices it makes no sense to send US LNG to Asia.As a result of these dynamics, LNG delivery volumes into Europe surged in Mar-19 to their highest level in history.
This coincided with a second European gas market record. Russian import volumes in Mar -19 were also the highest in history. Gazprom has shown no inclination to ease back on supply as prices have fallen.
As well as very strong import volumes, European gas demand has been relatively weak. Q1-19 has been unseasonably warm. Coal prices have also been falling, reducing the gas price switching levels at which incremental power sector gas demand kicks in. And European industrial and manufacturing data across Q1-19 has been very weak (particularly in Germany & France).
At what price levels will US export supply be shut in?
The Q1-19 TTF price decline brings US LNG export ‘shut in’ levels sharply back into focus. Chart 1 shows our estimated TTF shut in price range for US export flows (the grey shaded band). This represents the range where TTF prices no longer cover variable liquefaction, shipping and regas costs for delivery into Europe (i.e. where Gulf Coast LNG netback prices become negative).
LNG vessel spot charter rates have fallen 80% since Q4 2018 and are currently around $40k/day (down from above $200k/day). This has pulled down US LNG shut in price levels relative to 2018. We calculate the US export shut in price range based on:
- Feedgas & variable liquefaction costs – benchmarked at 115% of the Henry Hub price
- Shipping costs – ranging from 0.65 to 1.20 $/mmbtu depending on factors such as use of boiloff gas and treatment of single vs return voyage costs
- Regas costs – ranging from 0.1 to 0.3 $/mmbtu depending on sunk cost access dynamics.
These numbers gives a current US shut in range of 4.0 – 4.8 $/mmbtu. TTF front month prices last week were touching the top of that range at 4.8 $/mmbtu. By the bottom of the range we should start to see significant price support given the potential shut in of a portion of the 42 mtpa of expected US export volumes.
In the meantime, pricing dynamics at European hubs are firmly focused on gas for coal switching in the power sector. It is this key mechanism that we return to explore in more detail next week.

