Between 2005-10 there was a mini boom in CCGT investment in Germany and the Netherlands. These projects reached FID against a backdrop of relatively healthy gas-fired generation margins (spark spreads). But by the time CCGTs were commissioned, owners were confronted by a relentless decline in margins.
Renewable penetration gathered pace eroding CCGT load factors. Large new & efficient coal plants also came online, with falling coal and carbon prices increasing the competitive advantage of coal vs gas plants.
But the most pronounced value hit for CCGTs came from the erosion of electricity demand as a result of the global financial crisis. With CCGTs on the margin in most markets, falling demand translated directly into falling load factors & margins.
CCGT values & spark spreads plumetted across 2010-15. But margins started to stabilise in 2016 as gas for coal plant switching gathered momentum. The last 12 months have seen further CCGT margin improvement as European hub prices plummeted. And capacity mix changes over the next 3 years point to a more structural margin recovery.
Today we summarise what we think is an interesting contrarian investment case in existing German & Dutch CCGTs, targeting a 10 year horizon.
Gas for coal switching has driven margin recovery
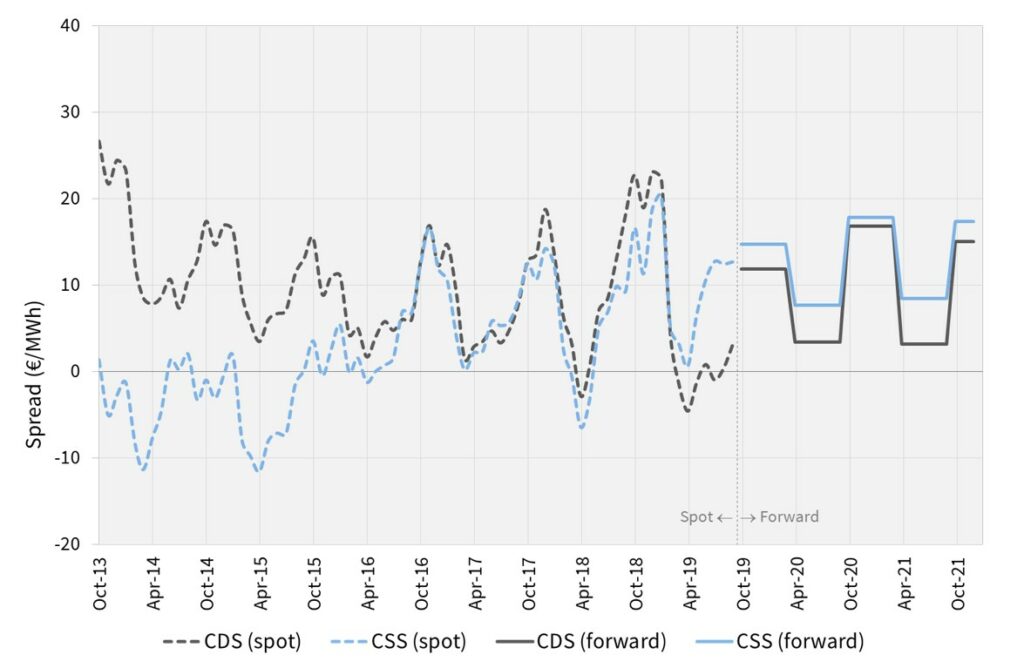
Between 2010 -2015, relatively low coal & carbon prices underpinned a structural variable cost advantage of coal plants over CCGTs. Clean spark spreads were negative, even on a peak basis, as shown in Chart 1.
Chart 1: Peak German Clean Spark Spreads & current forward curves

Source: Timera Energy, ICE
As a result CCGTs, many of which were newly commissioned, were effectively demoted to a peaking backup role.
The 2016 slump in gas prices started a recovery in sparkspreads and CCGT margins. This margin recovery reversed to some extent across the first three quarters of 2018 as gas prices rose again. But since Q4 2018 there has been a further sharp increase in CCGT generation margins, with plants running predominantly baseload across Summer 2019.
The volatile nature of spark spreads illustrates why it is tough to build an asset investment case on market price views alone. So are there other structural drivers supporting CCGT margin recovery?
Sweeping NW European capacity closures
The German power market is facing almost 25GW of regulatory driven plant closures over the next 3 years. This is a combination of closure of the nuclear fleet and closure of hard coal & lignite to meet Coal Commission targets.
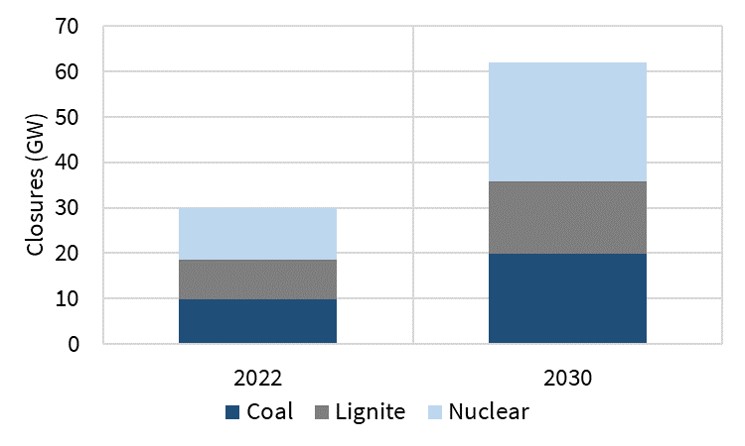
But Germany is not unique. Coal & nuclear closures are a theme across NW Europe. Chart 2 provides a summary of of cumulative regulatory driven closures across NW Europe. These numbers are large: 30GW by 2022, more than 60GW by 2030 (and this does not include ‘end of life’ closures of ageing CCGT plants).
The scale of closures over the next 3 years will significantly tighten the German and NW European power market balance. Gas-fired plants are set to take up the slack, transitioning to dominate the setting of marginal power prices. In other words, capacity closures will structurally increase gas-plant load factors.
Building a CCGT investment case
There is a well-worn narrative as to why investment in NW European CCGTs is a bad idea: ‘Renewables deployment erodes margin… Decarbonisation risk is growing… Margins are volatile & commodity price dependent… And look at the writedowns owners have suffered over the last 5 years!’.
All of the elements of this narrative are undeniably true. But an asset investment case depends on the relationship between risk adjusted returns and asset acquisition cost. A strong consensus narrative is typically reflected in asset prices.
So let’s turn the problem on its head and approach it by defining a set of 5 drivers that could underpin an investment case:
- Motivated sellers: Utilities have taken CCGT writedowns. They are also strategically shifting business models away from owning thermal power assets. Relatively new assets have transacted for cents in the dollar (vs build cost).
- Buying optionality: CCGT acquisition can be thought of as buying spark spread optionality. After a tough decade, this optionality is now back ‘in the money’, reducing the risks & costs of value capture. This optionality means asset owners are long volatility… in an environment of rising renewables & structurally tightening energy & capacity balances.
- Barriers to entry: Retaining existing CCGTs is the cheapest form of incremental system flexibility (outside specific applications for short duration batteries). The biggest margin threat for existing CCGTs is new CCGT build… but the investment case for new CCGTs just gets tougher as decarbonisation risks grow.
- Defined timeline: Plant closures over the next 3 years are not a hypothesis – they will almost certainly be implemented (with German efficiency). That underpins a clear 5 year margin recovery case & target payback window. It is easy to under-estimate further optionality & upside value beyond this (e.g. via introduction of explicit or implicit capacity payments).
- Decarbonisation: It is brave to bet against decarbonisation given the current policy momentum in Europe. Yet the more action accelerates, the faster the closure of coal and the bigger the hurdles to new CCGT build. Over a 5-10 year horizon, CCGT owners are long decarbonisation.
Now to dampen all the enthusiasm with a very practical caveat. Not all CCGTs are created equal – the right flexibility, location & plant cost structure are key to making the numbers work.


