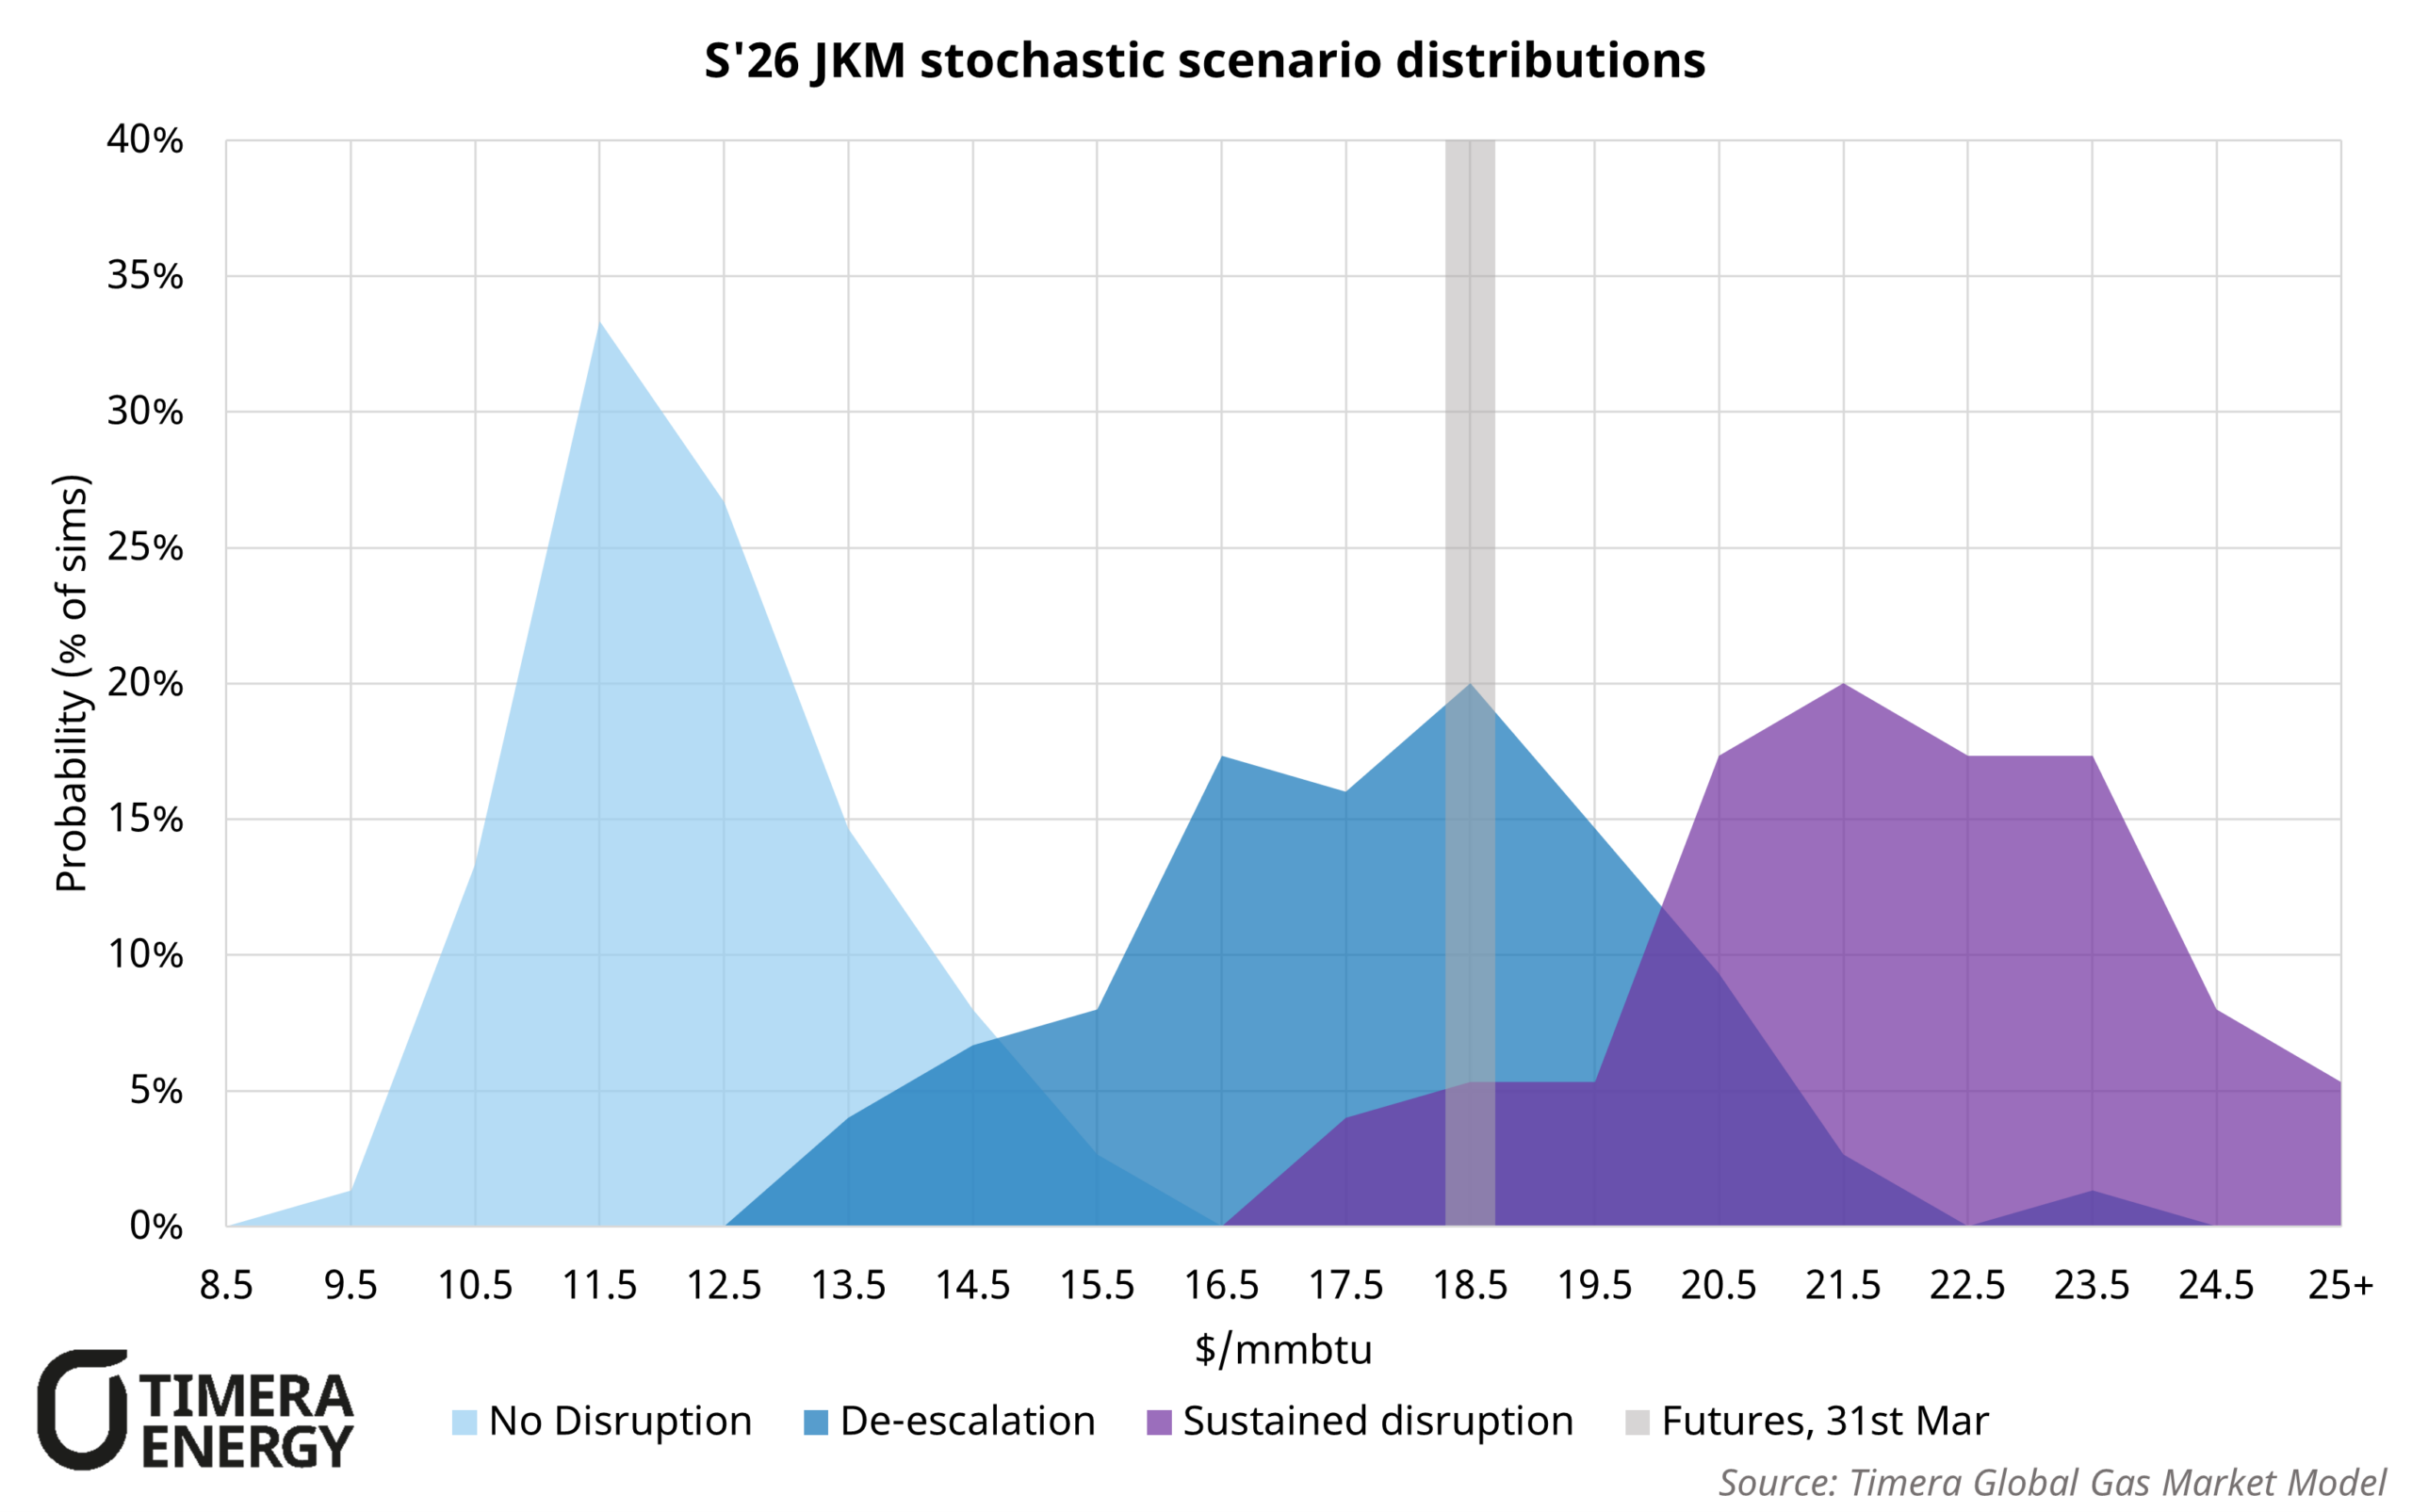
In the chart, we explore two scenarios for differing lengths of Middle Eastern LNG supply disruption vs pre-crisis conditions. For each scenario we run hundreds of simulations reflecting uncertainty in both underlying commodity price risk (Henry Hub, Brent, coal, charters) and broader gas market fundamentals (weather driven demand variability, non-Middle Eastern supply disruptions, maintenance uncertainty and other factors).
This generates distributions of expected prices which we can compare against futures to draw insights on market pricing and risk.
Summary of two scenarios:
- De-escalation: Strait of Hormuz remains closed through most of May, before a gradual reopening begins in late May, with partial disruption extending over June and July. Infrastructure damage remains limited to trains 4 and 6 at Ras Laffan South, with facilities under construction delayed by 5-7 months vs pre-crisis assumptions.
- Sustained disruption: Strait of Hormuz remains fully closed into October 2026, before a gradual reopening begins through W’26. Infrastructure damage assumptions are consistent with de-escalation, with facilities under construction delayed by 8-12 months vs pre-crisis assumptions.
5 key takeaways:
- S’26 futures (31st March) of ~$18.5/mmbtu sit broadly in line with our de-escalation central case median. Market pricing is broadly consistent with our modelled scenario of disruption continuing through May, before a gradual reopening over summer.
- Seasonal spread structure tells a different story. The current flat summer-winter spread in futures is inconsistent with our de-escalation scenario, which implies significant backwardation as Qatari flows resume mid-summer and the US supply wave builds into winter. The flat spread could reflect the market pricing in a risk premium associated with more structural disruption risk, reflecting partial or prolonged Hormuz restrictions persisting well into winter.
- Price distributions under disruption scenarios are materially wider than the pre-crisis case, reflecting the market operating on a more inelastic portion of the demand curve. European coal-to-gas switching flex and Asian oil-to-gas switching flex, previously assumed to be on the margin in S’26, are now largely exhausted.
- The market is instead forced to balance through more inelastic and opaque demand destruction mechanisms. This is directly visible in our stochastic modelling, where small changes in supply or demand drive disproportionately larger price moves than in the pre-crisis environment. This is the analytical basis for the elevated volatility observed since the onset of conflict.
- Sustained disruption creates a materially wider and right-skewed distribution, with meaningful probability of prices settling above $25/mmbtu. This tail risk is not reflected in current futures pricing and represents the key asymmetric upside risk facing the market through winter 2026-27.
Contact us
The above is an extract from our Q1 2026 Global Gas Service update, a crisis special edition published to subscribers on 31st March 2026. For further details, including to request a more detailed excerpt of this report or discuss the analysis in more detail, please contact Luke Cottell (Associate Director, Gas & LNG) at luke.cottell@timera-energy.com.
Subscribers to our Global Gas Service receive the full report, associated databook, including key stochastic and flex insights, as well as ongoing access to Timera’s team of market experts.