European gas demand fell by approximately 20% over the first five years of this decade. But 2016 marked a turning point, with demand (including Turkey) rising by 27 bcma (or 5.4%). Of this increase approximately 75% (or 20 bcma) was driven by higher power sector demand.
The switching of coal plants for CCGTs was the key driver behind the demand increase. More than 40% of incremental gas demand in 2016 came from the UK (where the gap between coal and gas marginal costs is narrower than the continent due to the carbon price floor).
What is perhaps surprising is that this increase in power sector gas demand was not the result of falling gas prices. Spot prices at European hubs rose significantly across the second half of 2016. So how is this consistent with a shift to gas-fired power plants?
Linkage between coal and gas prices
It is the relative level of gas vs coal prices rather than absolute gas price levels that drives gas for coal switching in the power sector. Gas prices rose as 2016 progressed, but the proportional rise in coal prices was greater.
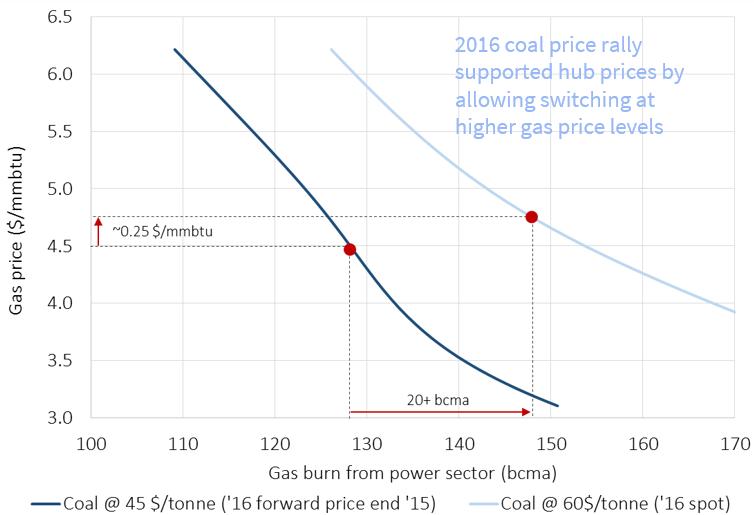
Chart 1 shows power sector demand curves for two different levels of coal price:
- 45 $/tonne: the Calendar 2016 forward price at the end of 2015
- 60 $/tonne: the approximate average outturn spot price across 2016
The two blue lines in the chart can be thought of as an aggregate gas demand curves for the European power sector. In other words the lines show aggregate gas burn (bcma) as a function of gas price, for a given coal price level (45 and 60 $/t). We generate these demand curves by running multiple combinations of gas and coal prices through the pan-European power market model.
The chart shows a move to the right in the European aggregate demand curve as a result of the 2016 rise in coal prices. As a result of this demand curve shift:
- Outturn gas hub prices in 2016 rose approximately 0.25 $/mmbtu relative to the Calendar 2016 forward price level at the end of 2015
- Power sector gas demand increased by 20 bcma from 2015 levels
The chart also provides an indication of what would have happened if coal prices had remained at 45 $/tonne in 2016. Under this weaker coal price scenario, European gas hub prices would have had to have fallen by over 1.0 $/mmbtu to have allowed the European power sector to generate an equivalent 20 bcma increase in demand. In other words the fact that coal prices roughly doubled between Q1 and Q4 2016 was a big factor supporting hub prices.
As the LNG glut grows, power sector switching will be a key mechanism allowing surplus LNG volumes to be absorbed by European hubs. It is worth watching coal prices and power sector demand closely in 2017 as a driver of both European hub prices and spot LNG prices.
Article written by David Stokes & Olly Spinks

