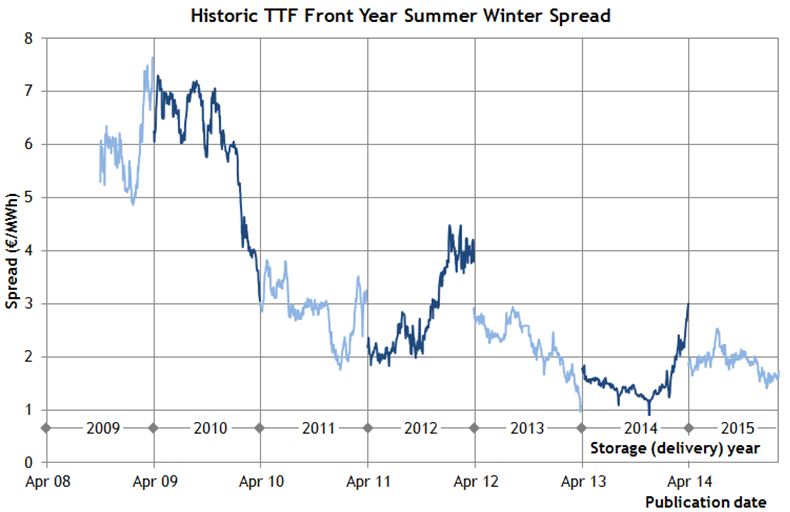
After a recovery in the first half of 2014, seasonal price spreads at European hubs have again fallen back towards historically low levels (currently around 1.70 €/MWh). Given summer/winter spreads are the key market price signal for seasonal flexibility, there has been an associated decline in the market value for storage capacity.
GasTerra has been auctioning storage capacity for 4 years now. The standard bundled unit (SBU) has become a transparent and objective benchmark for the value of flexibility in the NW European gas market. It also provides a useful benchmark for the level of extrinsic value which capacity buyers are prepared to pay for, over and above the intrinsic spread value that can be hedged against forward prices.
The latest auction for GasTerra capacity was held last week. In this article we show some simple analysis of the results and consider implications for flex value.
Seasonal spread evolution
Chart 1 shows the evolution of seasonal spreads at the Dutch TTF hub since 2008. It clearly illustrates how the development of an oversupply of seasonal flexibility has driven down summer/winter spreads. Spreads have fallen from above 6 €/MWh in 2008-09 to below 2 €/MWh in 2013-14.
There have been isolated years where spreads have made a brief within year recovery. For example high volumes of storage withdrawals in Q1 2014 after a mild winter, saw a sharp drop in summer prices which temporarily fed through into a higher summer/winter spread. But as yet there is no evidence of any structural recovery in seasonal spreads that can be observed in forward market pricing.
Feb 15 GasTerra auction result
Hub price signals are now the primary driver of the value of European gas flex (e.g. storage, swing). Seasonal hub price spreads drive the return on seasonal response. Prompt volatility drives the return on rapid flexibility response.
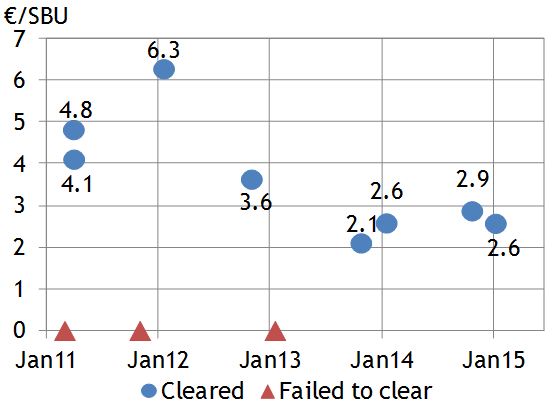
The auction clearing prices for GasTerra SBU capacity (shown in Chart 2) illustrate the strong relationship between seasonal storage capacity value and TTF summer/winter price spreads.
Over the last 4 auctions (Q4 2013 to Q1 2015) prices for GasTerra capacity have stabilised in a 2-3 €/MWh range. The different results across these auctions can be explained by marginal differences in forward spreads, absolute gas price levels and extrinsic (volatility) value capture dynamics.
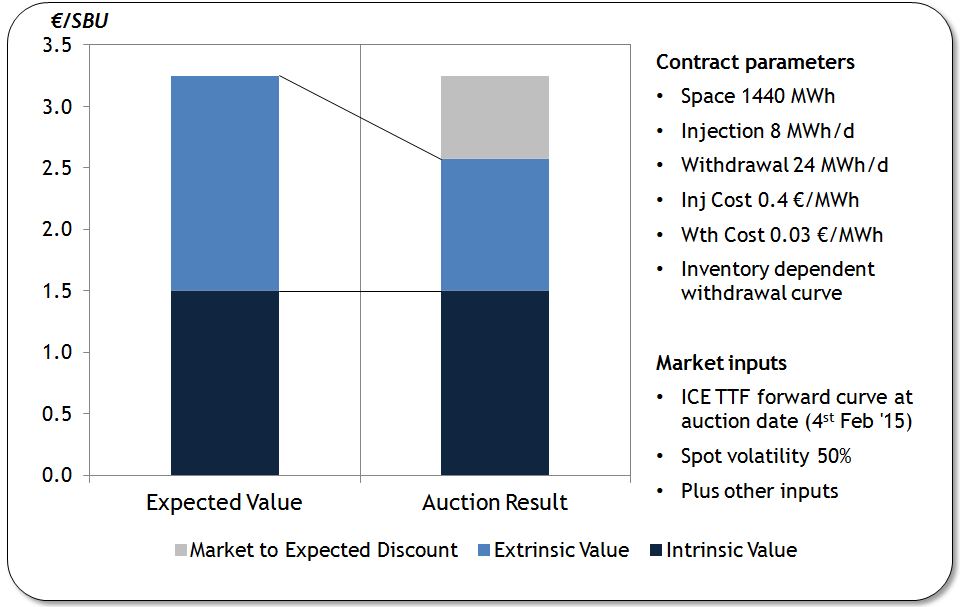
We have undertaken a simple analysis of the outcome of the February 2015 auction in Chart 3. In order to do this we have calculated our view of the expected value of the GasTerra SBU using the Timera Energy storage modelling suite (shown on the left). This is then compared to the actual auction results (on the right).
There is a relatively high proportion of extrinsic value given that seasonal spread levels are so low (i.e. storage optionality is close to ‘at the money’). Our analysis indicates that the market is paying for just over 60% of extrinsic value. This is consistent with the logic that capacity buyers need to allow for a margin to cover trading costs (e.g. risk capital and transactions costs).
Some practical implications for storage capacity
There is a soft lower bound on seasonal spreads at around the 1 €/MWh level reflecting the transactions costs involved in cycling storage capacity to move gas from summer to winter. Market pricing is pretty close to that level with current spread levels around 1.70 €/MWh. That means that there is asymmetric upside from spread recovery.
However asymmetric upside does not in its self mean that spreads will necessarily recover anytime soon. But it does impact the management of exposures by capacity owners and buyers. For example it is being reflected in the behaviour of storage operators (e.g. GasTerra, TAQA Bergermeer) who are selling capacity on an indexed basis (i.e. retaining spread exposure when they sell capacity).
There are going to be several important factors to watch moving into 2015 that could impact the evolution of European seasonal hub price spreads:
- The seasonal volume profile of LNG flows into Europe (e.g. high volumes in summer given weaker global demand, lower volumes in winter given stronger global demand)
- The gas vs coal plant competitive balance and its impact on power sector gas burn (particularly in the UK with the carbon price floor)
- The impact of weakening economic growth projections in Europe and associated impact on gas demand
We will keep a close eye on these factors as the year evolves.


