The term ‘big price move’ is used too liberally in relation to energy markets which have a relatively high level of ambient volatility. But last week’s decline in the Brent crude curve was a big move by any standards. This decline in Brent will have profound repercussions for an already weakening LNG market. And these will feed through into European gas and power markets in 2015.
OPEC’s Saudi led Middle Eastern producer block has thrown down the gauntlet to non-cartel producers. By maintaining production targets and implicitly accepting associated price declines they have initiated a battle for market share with both the US and Russia. As a result the front month Brent contract crashed through 70 $/bbl on Friday. And more importantly, the front 3 years of the Brent curve has re-rated towards $80/bbl.
The move lower in Brent will act to drag down long term LNG & European gas contract prices with several months lag. This increases the chances of a substantial decline in European gas hub prices in 2015. It also opens up the potential for a return to supply glut conditions (similar to 2009-10).
In this environment of ‘tectonic’ movements in energy prices, market interconnectivity plays an increasingly important role. European gas hubs may play an important role in stemming the declines in spot LNG prices. In turn European power markets may act to provide key support for European gas hub prices.
An update on the LNG spot price fall
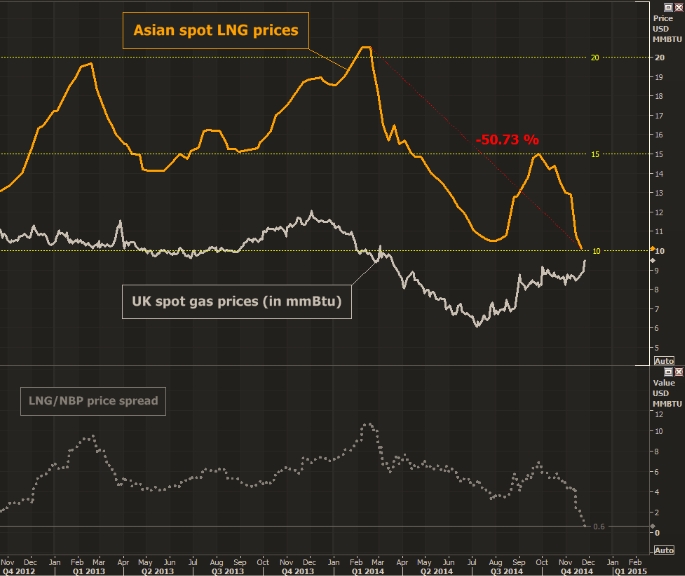
Last week we looked at some of the drivers of this renewed slump in LNG spot prices. The lead up to the last few Christmas periods has become associated with robust demand and rising prices. But this year Asian buyers have ample supply, storages are full and portfolio players are long LNG. As a result spot prices have crashed back to pre-Fukushima levels.
Chart 1 is an update of Reuter’s Asian LNG spot vs UK NBP price chart that we showed last week. The differential between these two prices is falling towards zero. That means Europe is becoming a much more attractive place to ship LNG, despite it being winter. This is going to be a key chart to watch over the winter as an indicator of:
- The volume of LNG import flow into Europe (both spot cargoes and contracted European supply which cannot be economically diverted).
- The price of incremental LNG import volumes if there are supply issues in Europe over the winter (e.g. Russian interruptions or major infrastructure outages).
But it also may have important implications for European power markets.

