One of the European energy market surprises of 2021 has been a lack of pipeline gas supply responsiveness to strongly rising hub prices. Price responsiveness has historically focused on Russia (flex across years) and Norway (flex within year).
“North Africa is the only source of supply providing response to higher European hub prices”
Gazprom has shown no inclination to increase supply in response to higher prices in 2021. It has booked minimum levels of transit capacity to meet its supply obligations, with relatively low volumes flowing via the Ukraine/Slovak route. That may change once Nordstream 2 comes online, setting up increased flows along Gazprom’s preferred northern flow route.
Norwegian supply has been impacted this year by relatively heavy Q2 maintenance, likely delayed due to Covid restrictions last year. This is set to continue into summer.
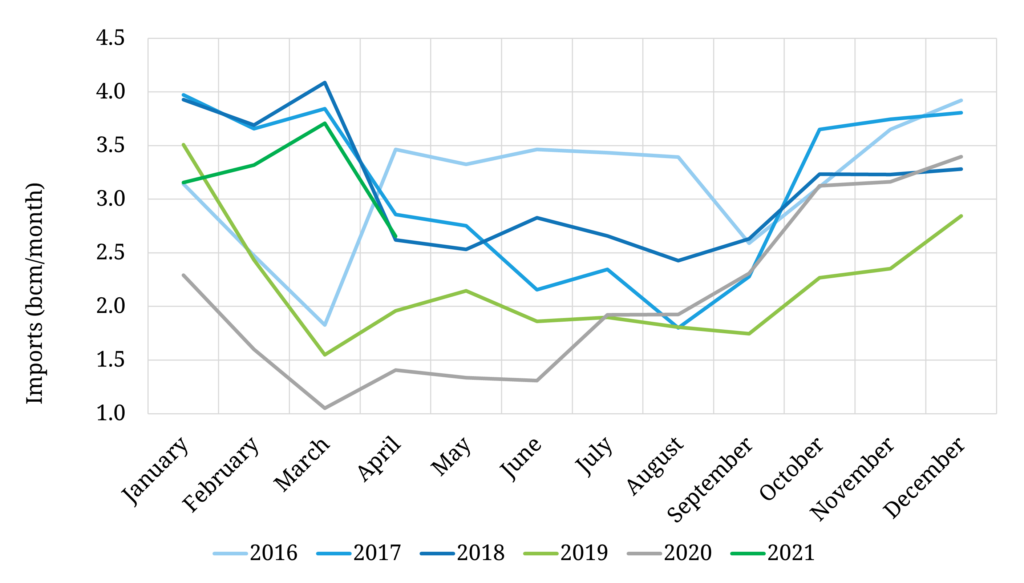
North African supply has been flying a little beneath the radar in recent years, but supply into Italy and Spain is increasing significantly in 2021. In today’s article we look at the often under-appreciated role of Algerian gas and the pricing dynamics in play.
The influence of oil-indexation is not quite dead yet
The influence of oil indexation on European hubs has largely disappeared over the space of the last 5 years.
Norway started the ball rolling with a much more open stance to hub prices. But it was Gazprom’s shift to hub linkage as a concession to the EU that really broke the back of oil indexation. Only around 10% of Gazprom gas sales remain oil indexed, down from close to 50% in 2017.
North African gas supply contracts remain dominated by indexation to Brent crude however. Algeria is the key supplier, accounting for 85-90% of North African exports (with Libya making up the balance). Algeria accounts for 25-35 bcma of European gas imports (depending on pricing & supply dynamics), with about 50% of this flowing to Italy and the other 50% to Spain.
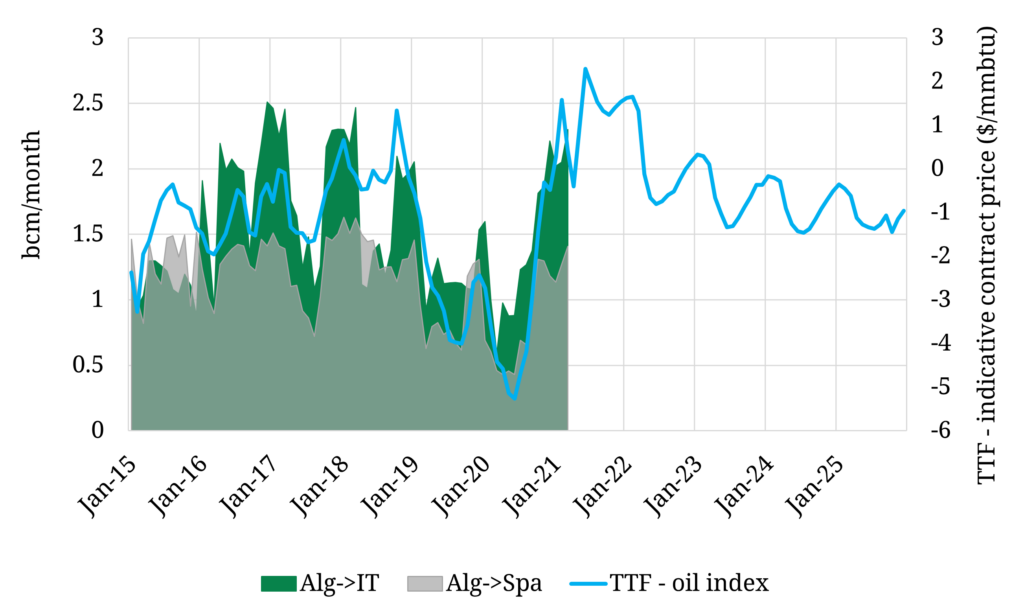
Algerian contract flows have a strong relationship to the spread between hub prices (e.g. TTF) and oil-indexed contract prices, as shown in Chart 1. This reflects buyer nomination of the oil-indexed contracts, based on optimisation against hub price signals.


