LNG and gas market risks increase into the northern hemisphere winter, driven by the threat of cold weather.
The European gas market has faced heightened risks from a cold winter since Russian supply cuts in 2021-22. Every winter there is an element of rolling the dice against the gods.
Europe no longer faces a serious threat to security of supply given new regas infrastructure & storage mandates underpinning inventory levels. However, the risk of asymmetric upside price shocks remains… at least for one more winter until the new wave of LNG supply gathers pace in 2026. And if Europe sneezes, the LNG market can catch a cold.
Let’s start with prices
Price is a powerful and objective arbiter of market evolution. Forward prices for Winter 2025 have fallen sharply compared with a year ago as shown in Chart 1.
Chart 1: TTF spot & forward price evolution
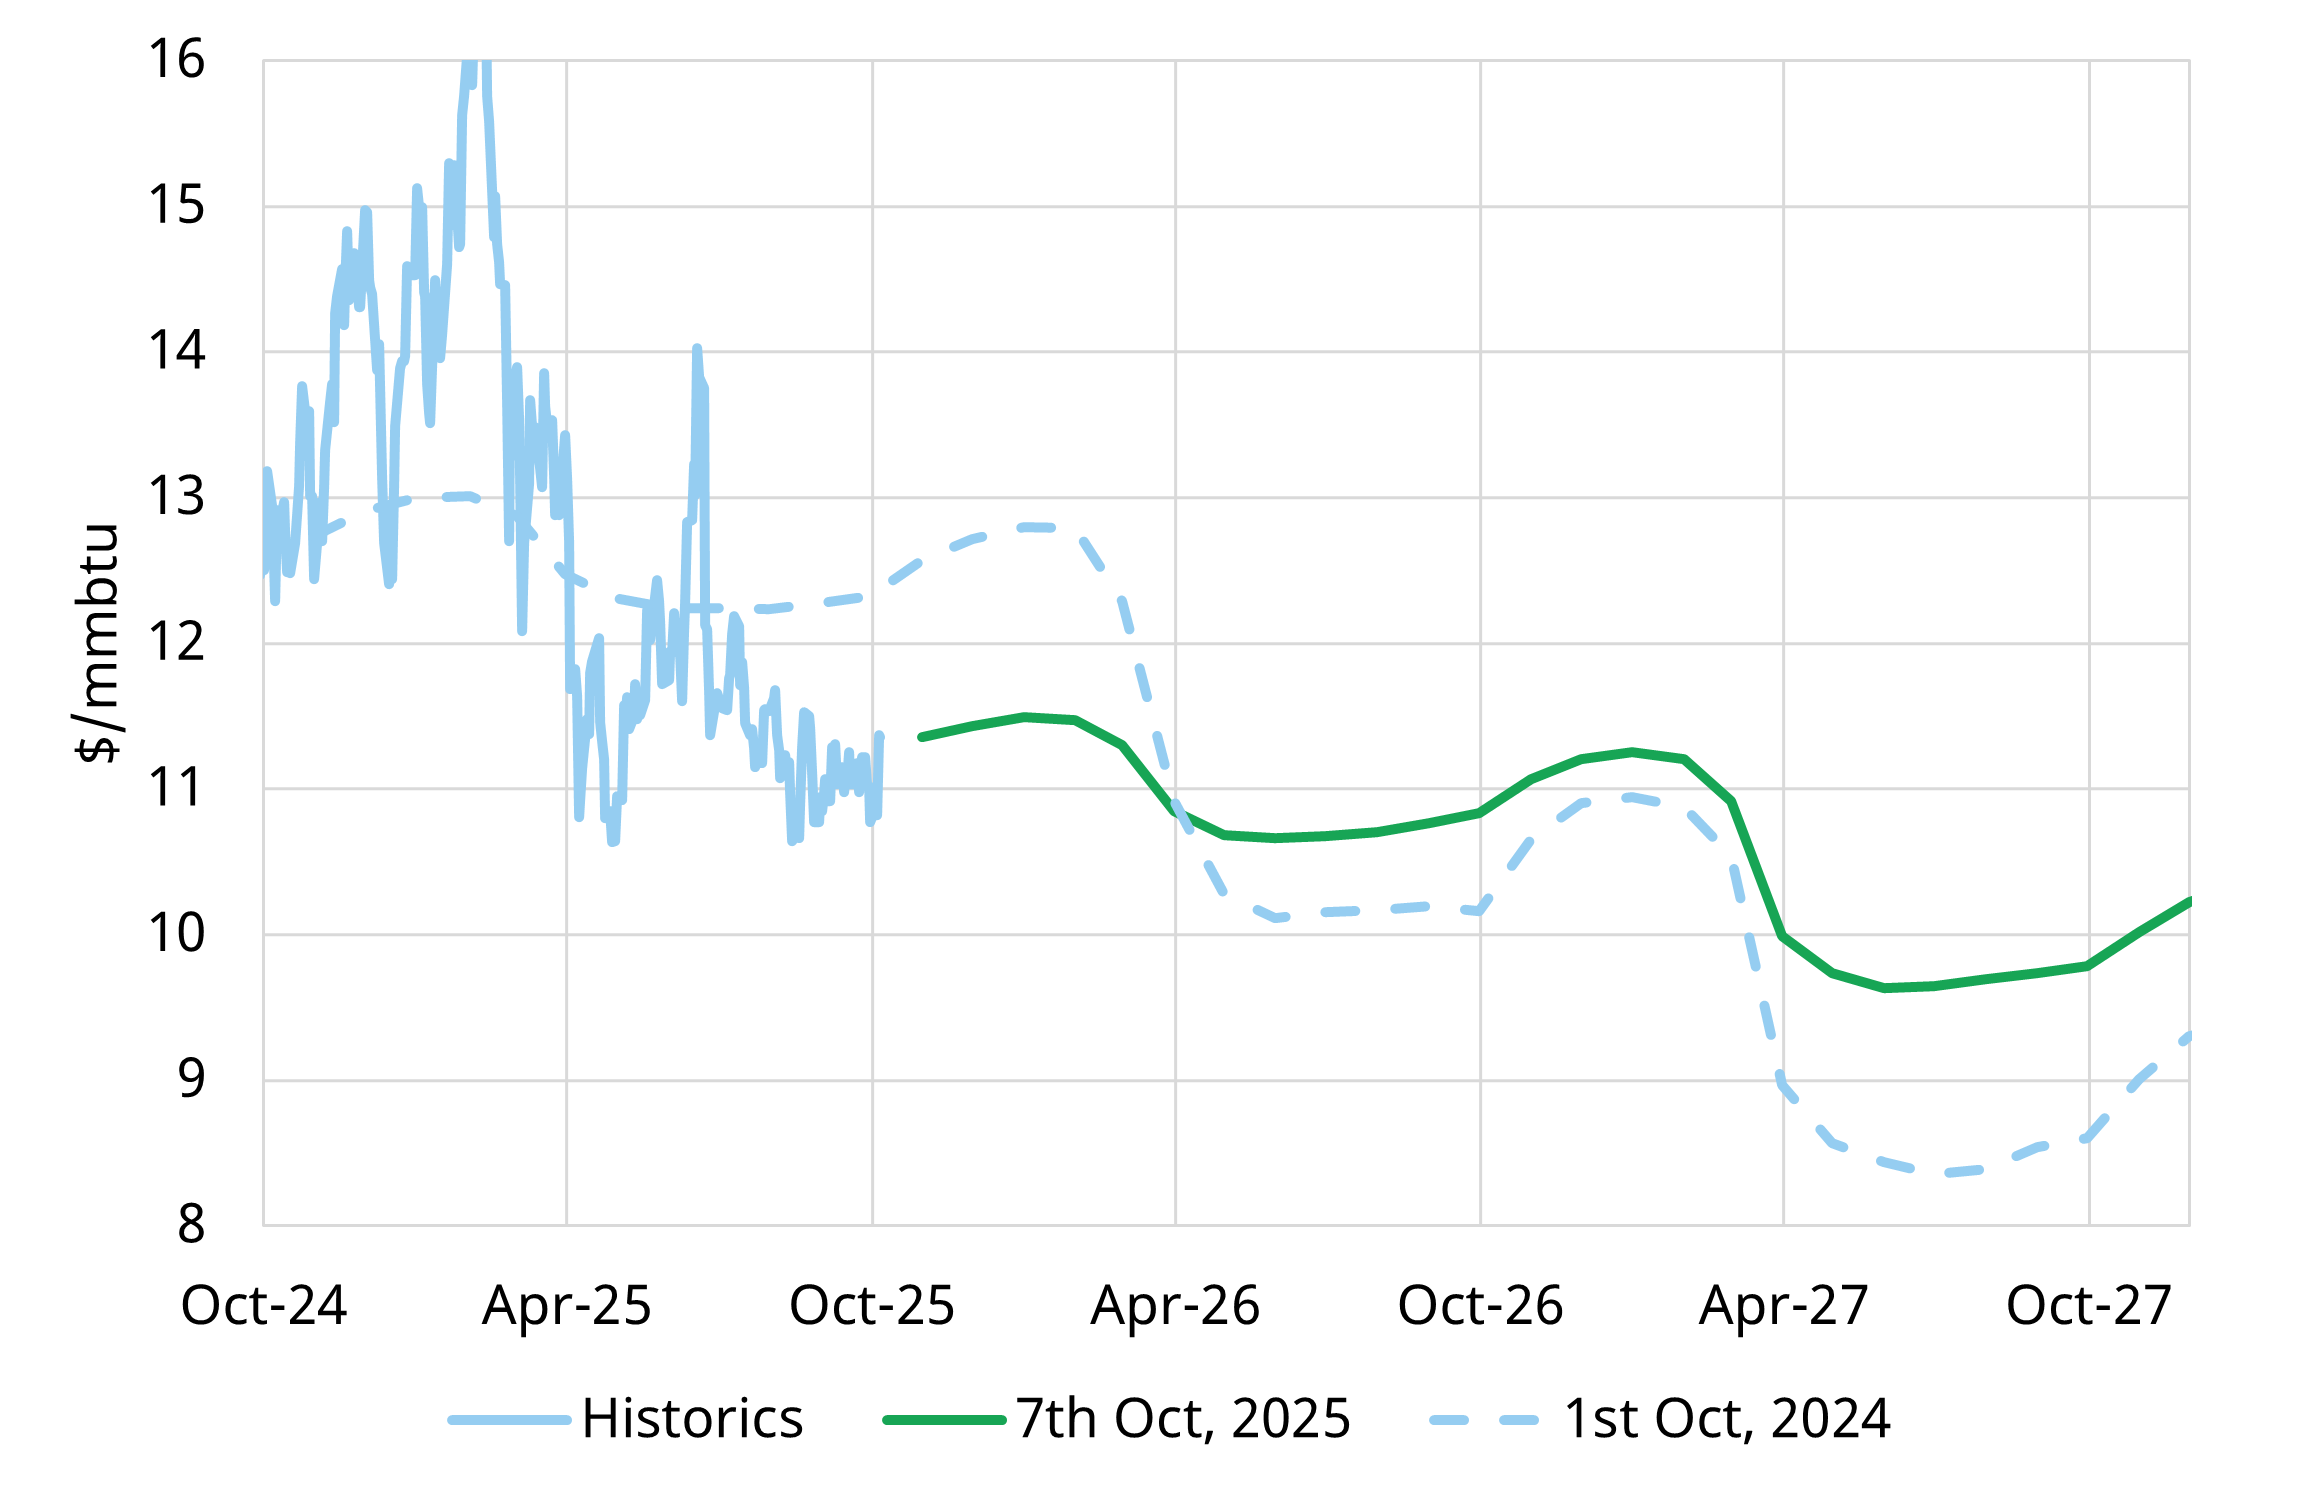
Source: Timera Energy, ICE
The decline in winter prices reflects stronger than expected European gas injections over the summer that have eased concerns around winter supply tightness.
The decline has been particularly pronounced relative to prices further along the curve, which remain broadly in line with last year’s levels. As a result, today’s forward curve shows little sign of the upcoming supply wave that is set to reshape market dynamics.
The new wave of LNG supply has started to ramp up in 2025. It is focused initially on North America, with new capacity coming online at facilities including Plaquemines, Corpus Christi and LNG Canada over the year to date. This supply wave is set to accelerate into 2026-27.
Our modelling shows ~14 mtpa (6.3% yoy) of supply growth this winter.
Despite this incremental supply prices remain elevated vs pre-crisis levels. The TTF winter forward curve strip currently averages $11.4/mmbtu vs a pre-crisis (2016-2020) winter average of $6.3 /mmbtu (and vs $13.7/mmbtu last winter).
Europe sits at the core of the global LNG market
European supply & demand balance is not only an important driver of European gas hub pricing, but of broader LNG market evolution.
Let’s compare European balances year on year to understand why the European picture remains tight.
Chart 2: Winter 2024 vs Winter 2025 (Oct – Mar) supply vs demand waterfall chart
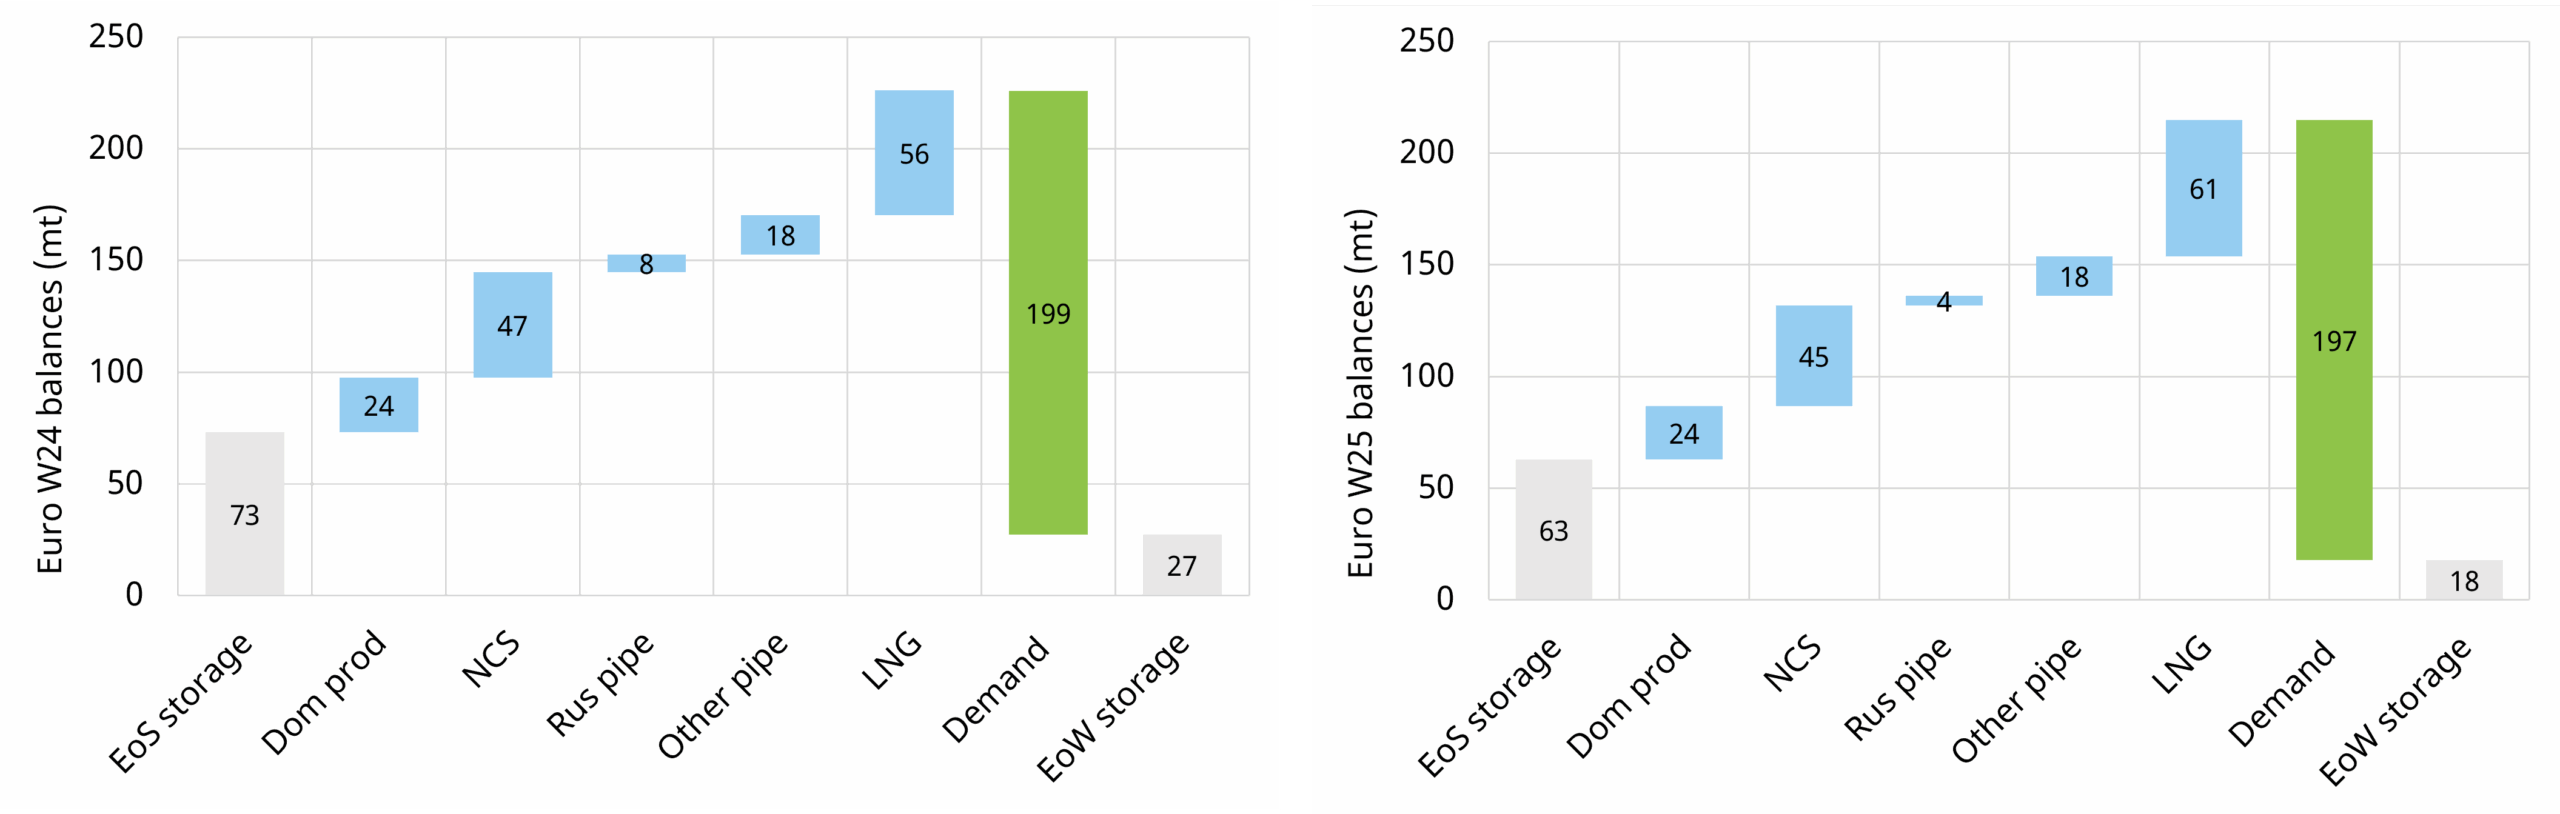
Source: Timera Global Gas Model, Eurostat, GIE, LNG Unlimited, ENTSOG
Underground storage inventories are important for understanding market balance. Europe entered winter (October) with around ~10mt lower storage inventory than at the start of last winter (despite narrowing the deficit vs the start of summer).
Further declines in residual Russian pipeline supply (Ukraine transit volumes) contribute to tightness.
How will Europe balance?
There are broadly 3 drivers which can act to balance the European market this winter:
- reduced demand year on year (e.g. due to weather or price response)
- increase LNG imports year on year
- exit winter with stocks lower year on year.
In terms of LNG imports, Europe is currently pricing aggressively to outcompete Asia for marginal US LNG over winter as shown in Chart 4. This reflects expectations that Europe’s LNG imports will need to grow year on year, absorbing some of the incremental LNG supply coming onto the market.
Chart 3: US Gulf Coast netback prices (Europe vs Asia)
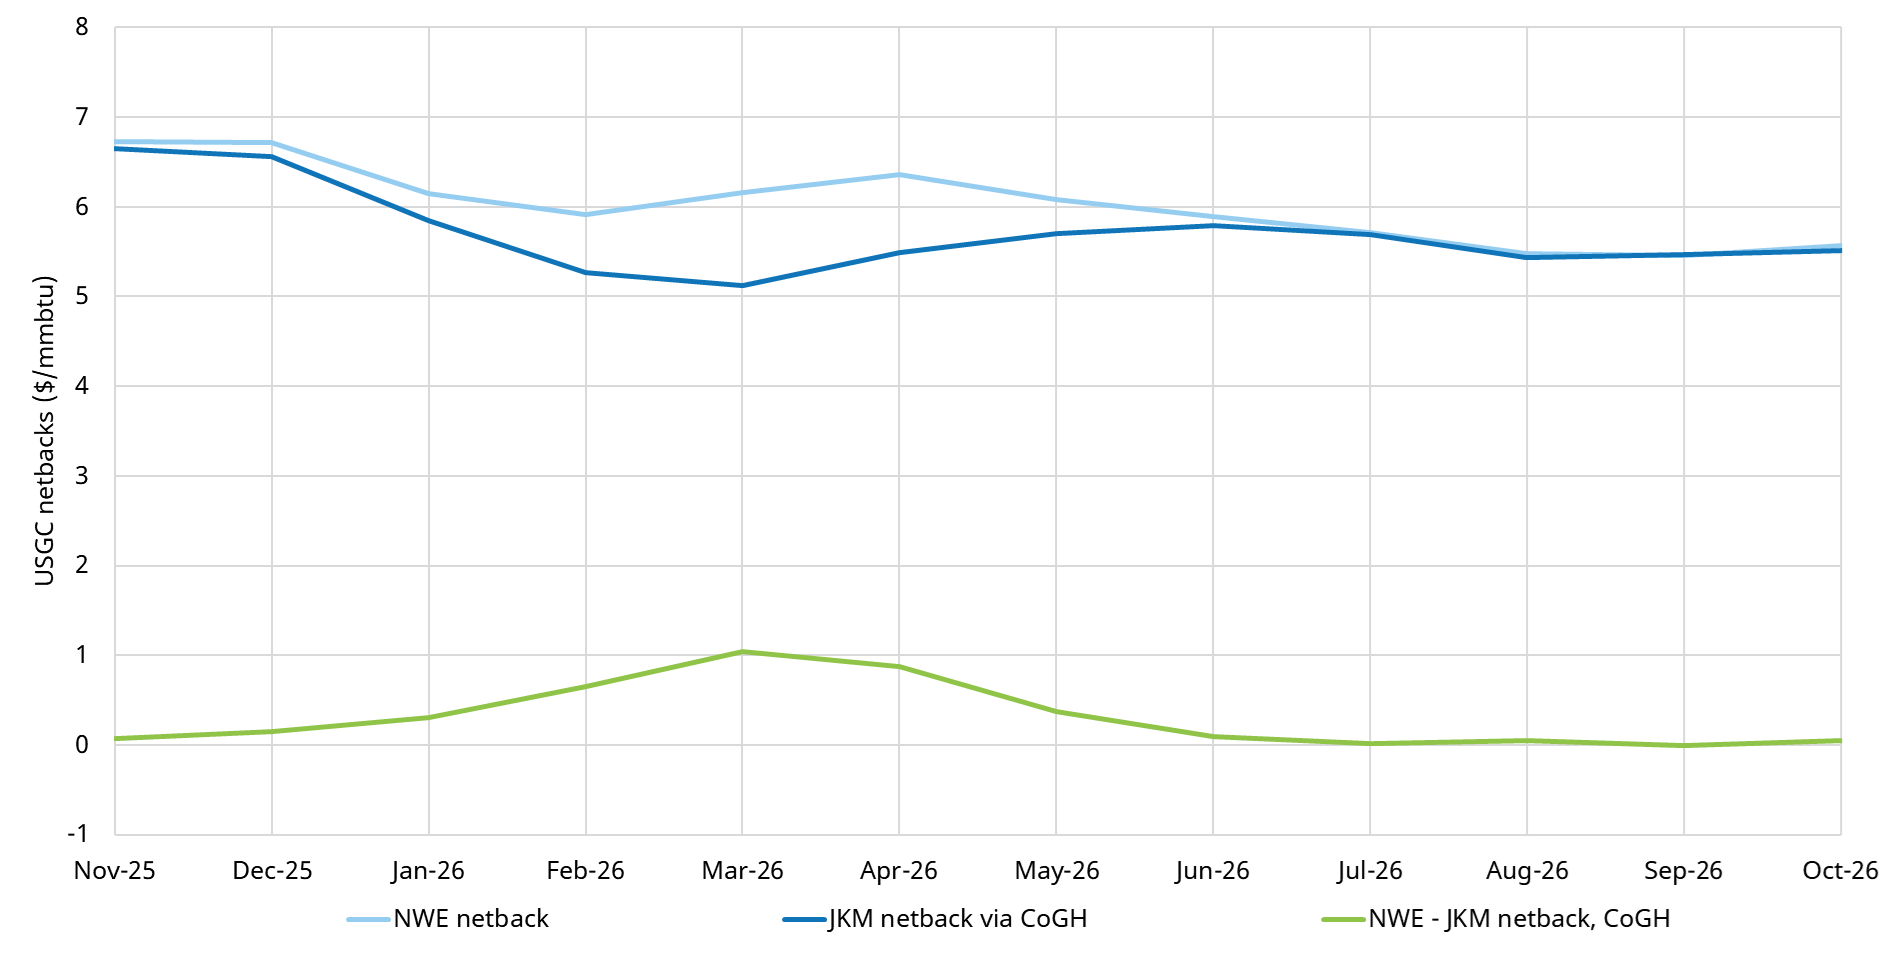
Source: Timera Energy, CME, Spark Commodities (prices as of 25th Sep 25)
The blue lines show US Gulf Coast netback prices from NW Europe (light blue) and JKM (dark blue), with the premium of European over Asian netbacks shown by the green line.
The European pull-on flexible LNG does however subside into next summer, with netbacks moving close to parity, suggesting a partial recovery in Asian demand.
Meanwhile, the incentive to withdraw gas from storage this winter has somewhat reduced as backwardation in curve eroded significantly across the last 3 months.
Winter outlook & key risks
Timera’s view is that European gas hub prices are likely to remain somewhat supported through Q4 2025, as Europe continues to bid aggressively for LNG cargoes rather than relying on rapid storage withdrawals given weather driven demand risks.
Assuming no major shocks (see risk table below), storage withdrawals could accelerate into Q1, with Europe easing its pull-on LNG as some Asian price sensitive demand returns.
Yet small changes in market balance can still drive large upward price swings. Our modelling shows:
- significant volumes of Asian demand being priced out at current future prices, and
- limited headroom for stronger European storage withdrawals, given inventories have entered winter short of tank top.
On the other hand, downside risks this winter are less pronounced. Europe’s system can tolerate lower storage drawdowns. Lower price levels should also gradually stimulate incremental gas demand, via oil-to-gas switching in Asia and coal-to-gas switching in Europe.
We summarise 5 key market risks across the coming winter in Table 1.
Table 1: 5 key market risks across winter
While Europe’s security-of-supply risk has eased, market flexibility remains thin. A cold winter in either hemisphere (or significant supply disruption) could still trigger sharp price volatility.
The dice is no longer loaded against Europe, but the market is still playing with a thin margin for error.
More details on LNG & gas market evolution?
Timera has recently published its Q3 2025 Global Gas Service update, covering:
- Recent market developments and the outlook for the coming winter
- Key changes to our long-term central projection versus Q2
- A revamped datasheet offering deeper insight into the data behind our analysis
For a copy of the report or to discuss our outlook, please contact David Duncan, Director, Gas & LNG: david.duncan@timera-energy.com.