We apply three simple rules when we analyse power prices:
- Confront the reality that the price forecast is going to be wrong
- Define the key market drivers likely to cause deviations from forecast
- Focus analysis on these drivers, rather than trying to capture spurious detail
This logic quickly points to the conclusion that fuel price assumptions are the primary driver of power price evolution. Taking the logic a step further, it makes sense to focus on the fuel price of the generation technology that dominates marginal price setting.
In the UK and Italy that is gas. In Germany it is coal. In markets such as France and Belgium it is a combination of the two.
There are of course other important drivers of power prices e.g. demand, capacity mix and cross border flows. But the impact of inputs such as half hourly wind profiles in 2032 are dwarfed by a 10% change in gas price assumption.
A UK power market case study
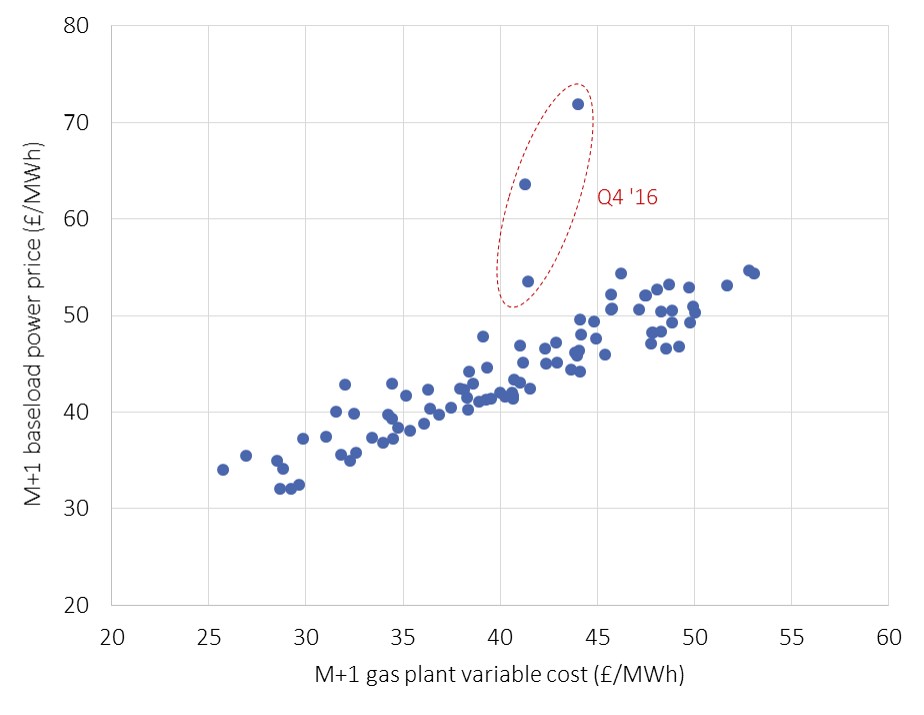
Let’s illustrate the importance of fuel prices using a practical case study from the UK power market. Chart 1 shows the monthly relationship between 2010 and 2017 of:
- UK month-ahead baselaod power prices (vertical axis)
- The fuel & carbon related variable costs of a CCGT asset @49% HHV efficiency (horizontal axis)
The strength of this relationship is pretty clear evidence of the fact that gas prices drive UK power prices. The carbon price is a second order driver, given it is a significantly smaller component of variable cost and carbon prices are currently relatively stable.
The deviations of power prices away from CCGT variable cost are predominantly explained by:
- Periods of CCGT margin rents (e.g. influence of coal units and start cost recovery in peak periods)
- System variable costs (e.g. Balancing Services Use of System (BSUoS) and flow based gas commodity costs)
It is only during periods of extreme market shocks that power prices materially diverge from CCGT variable costs e.g. during the French nuclear capacity closures in Q4 2016.Looking forward, the increasing penetration of renewables acts to erode the spark spread margin between CCGT variable cost and power prices. But gas prices are likely to remain a dominant driver of power prices well into the 2030s, given the influence of existing gas-fired capacity.
Fuel prices should be part of the analysis
We continue to be surprised how many power price forecasters avoid any detailed analysis of underlying fuel markets. Instead it is common to assume fuel curves are an exogenous input. In other words fuel prices only receive cursory consideration as assumptions, before the focus of modelling shifts to details of the supply stack.
What are your assumptions on Henry Hub gas price level, trans-Atlantic spread, Russian gas market share, Asian LNG demand and the cost structure of new LNG supply? Different combinations of these gas market drivers determine whether European hub prices will be at 4 or 9 $/mmbtu (both numbers are quite plausible over a 10 year horizon). In UK power market terms these gas price levels are broadly equivalent to power prices at 35 £/MWh or 65 £/MWh (an 85% range).
Fuel curves should be endogenous. In other words fuel price analysis should be just as much part of power market analysis as detailed stack modelling.
An even more dubious practice which is also common place is ‘borrowing’ public forecasts for commodity prices (e.g. from the IEA, EIA or other analysts). Or alternatively taking an average of multiple public sources to create a scenario soup.
Borrowing fuel prices may be convenient, but it ignores the fact that the assumptions behind these borrowed forecasts are almost certainly inconsistent with assumptions used for the rest of the power market scenario.
A robust understanding of power price evolution is built on an analysis of the fuel of the marginal price setting generators. Avoiding fuel market analysis is ignoring the crux of the problem. Outsourcing fuel curve assumptions is only a step away from outsourcing the power price forecast.

