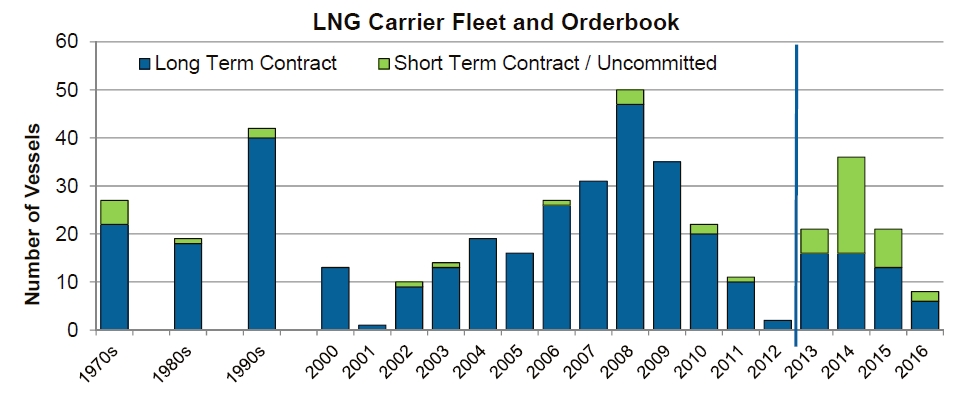
With rapid growth in the trading of spot and short term LNG cargoes, fluctuations in spot shipping charter rates are having an increasingly important impact on the pricing and flow of LNG. The LNG shipping market has evolved rapidly over the last decade, driven by growth in global liquefaction capacity. But the order and delivery of LNG vessels has been quite cyclical in nature.
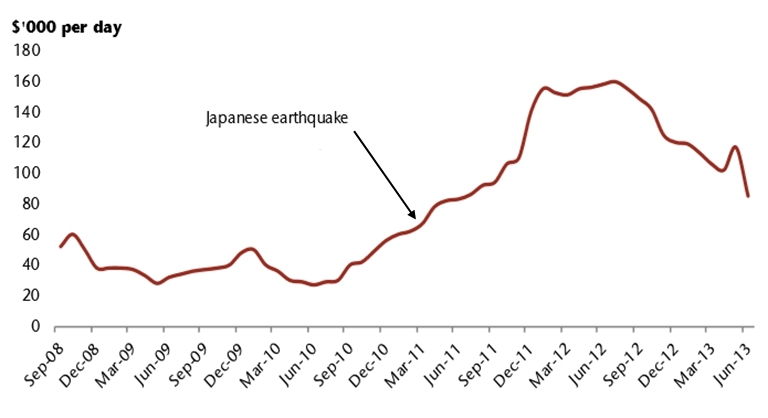
Shipping charter rates are the largest component of the cost of moving LNG around the globe. Break even charter rates are estimated to be around 60,000 $/day. But recent years have seen some wild swings in spot charter rates above and below this level.
Charter rates fell as low as 25,000 $/day at the depth of the financial crisis before recovering to 160,000 $/day post-Fukushima. Spot charter rates are currently around 90,000 $/day, but a surge in delivery of new vessels in 2013 and 2014 could again tip the LNG shipping market into a period of oversupply.
LNG shipping – the basics
The fleet
The global LNG fleet consists of around 380 vessels. The standard size for an LNG carrier has traditionally been 155,000 mcm. However over the last 3 to 4 years the size of many delivered carriers has increased to 170,000 mcm as infrastructure has evolved to deal with larger vessels.
For the Qataris, size is everything. They have developed their own fleet of Q-Max carriers with a capacity of 267,000 mcm. Liquefaction terminals in Qatar are specifically designed to cater for these large carriers, with the benefit of size being lower energy requirements (~40%) given economies of scale with engine efficiency.
The fundamental drivers
Historically, source to destination LNG contracts backed by dedicated shipping capacity made the forecasting of shipping capacity requirements relatively straight forward. However over the last decade, the evolution of LNG portfolio optimisation and growth in trading of spot cargoes has resulted in shipping market dynamics becoming much more complex.
Despite this complexity, demand for LNG shipping capacity can be broken down into two main drivers:
- The volume of LNG to be shipped. Higher LNG demand means higher demand for shipping capacity.
- Average journey time and the proportion of ballasted (un-laden) voyages. These factors are a function of the pattern of LNG trade flows, with longer average voyages and a higher proportion of ballasted voyages requiring more shipping capacity to move a given volume of LNG.
In other words, understanding LNG trade flows as well as global LNG demand growth is important in understanding tightness in LNG shipping capacity.
LNG shipping flows
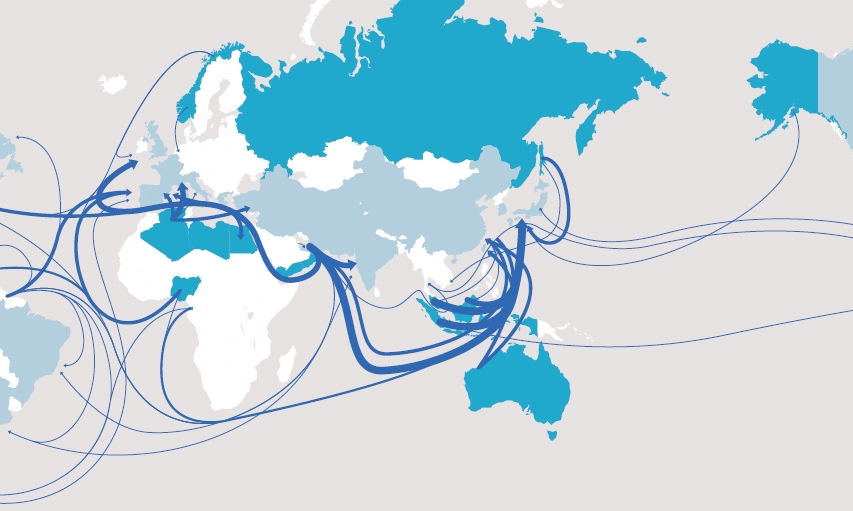
The shipping of LNG is focused on moving gas from producing nations to Asia. Key shipping routes include the Middle East to Asia, Australasia and South East Asia to Northern Asia and Africa to Southern Europe as illustrated in the schematic in Diagram 1.
