2024 has seen a sharp increase in negative prices across European power markets. This reflects a growing surplus of power in periods of high wind & solar output.
Rapid growth in low & negative prices has important commercial implications. For example they:
- support the value of storage & electrolyser assets which benefit from cheap power & price volatility
- act to increase balancing risks for wind & solar assets
- erode the margins of thermal assets (e.g. gas & nuclear)
- increase incentives for demand-side management.
In today’s article we set out analysis showing data on negative prices, look at a German market case study to dig into drivers and set out some key considerations for BESS investors.
In the past negative prices were mostly concentrated in countries such as Germany with very high RES penetration. However negative prices are quickly becoming a phenomenon across most European power markets as illustrated in Chart 1.
Chart 1: Evolution of total negative prices across Europe
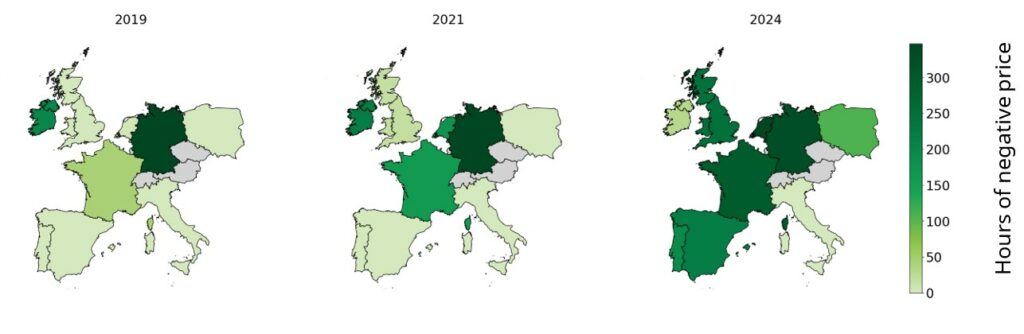
Source: Nordpool, EPEX, SEMOpx
Why do negative prices occur
Negative wholesale prices occur when generation outstrips demand, such as when RES generation is very high and demand is low. In order to balance the market, participants are literally paid to consume power in order to alleviate system surplus.
Selling power at negative prices may seem counter-intuitive a first, but there are a range of valid economic reasons why generators can be incentivised to sell power at negative prices. For example:
- Cost of ramping: For some thermal plant it can be uneconomical to switch of during short periods of negative prices as the cost of ramping outweighs the cost of continuing to generate.
- Exposure to imbalance prices: Being in imbalance can be very costly as imbalance prices can reach up to 15,000 EUR/MWh, buying power at negative prices can prevent exposure to these very extreme prices.
- Other contractual arrangements: Some generators may have arrangements such as steam contracts which mean they must continue running across certain periods of the day, regardless of wholesale prices.
- Subsidies: Many renewable subsidies across Europe are linked to generation output, hence there is an incentive to continue generating provided the negative price does not exceed the subsidy payment.
- Inflexible generation: Some generators do not have the flexibility to react quickly to negative prices e.g. nuclear or CCGTs ramping down below minimum stable generation levels and incurring additional start costs.
A German case study
Germany is a particularly interesting market when it comes to growth in low / negative power prices, because of the rate of penetration of both wind & solar.
Chart 2: Cumulative frequency of negative prices across recent years
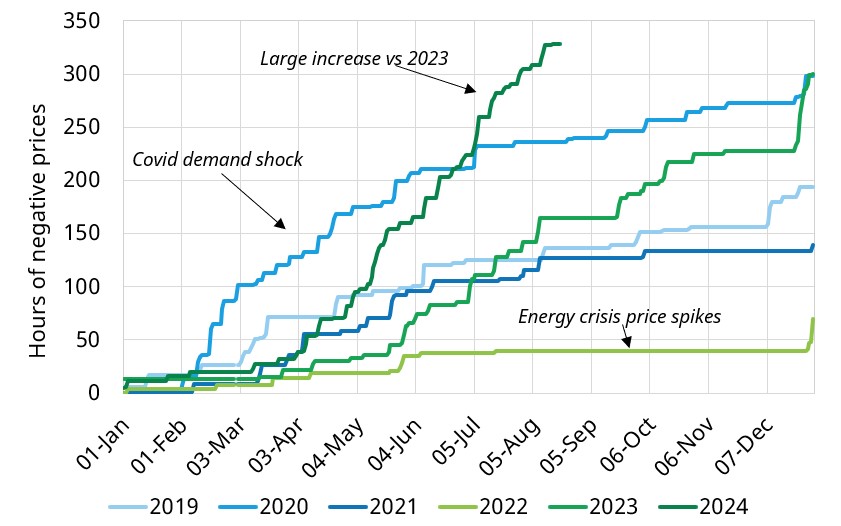
Source: EPEX
Germany has seen a significant increase in negative pricing over the past few years, with 2024 having a record number of negative priced hours (as shown in the chart).
This increase in negative pricing has been driven by the rapid deployment of RES as Germany attempts to close the gap on its ambitious 2030 targets of 216 GW of solar and 145 GW of wind capacity.
Chart 3: Growth in German renewable capacity
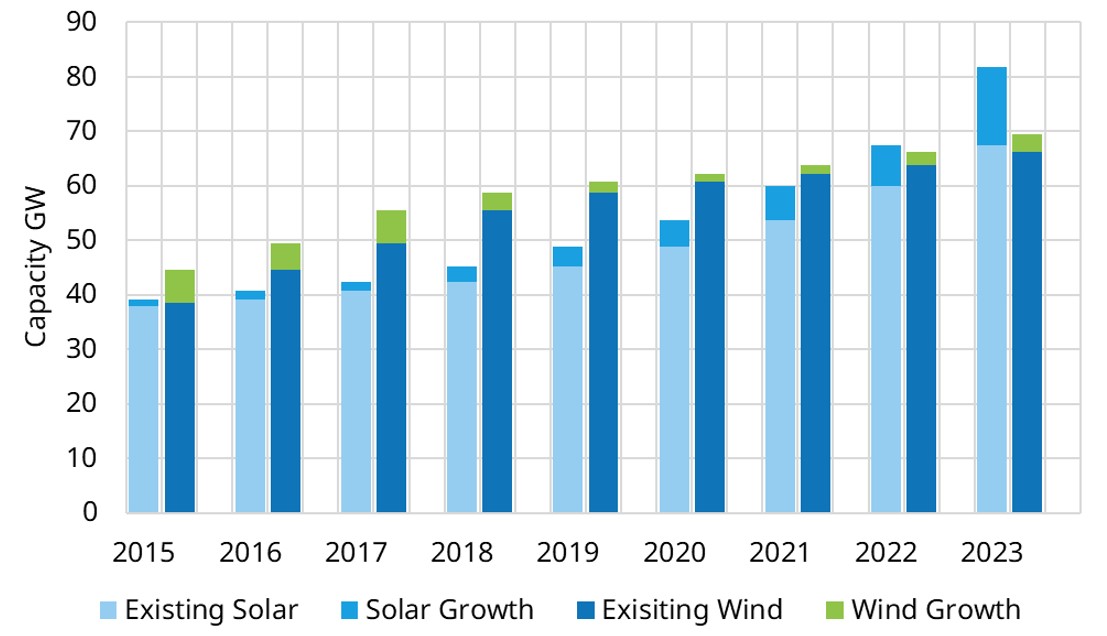
Source: ESO
The impact of RES growth on German day ahead price shape can be seen in Chart 4.
Chart 4: German summer day head price shape
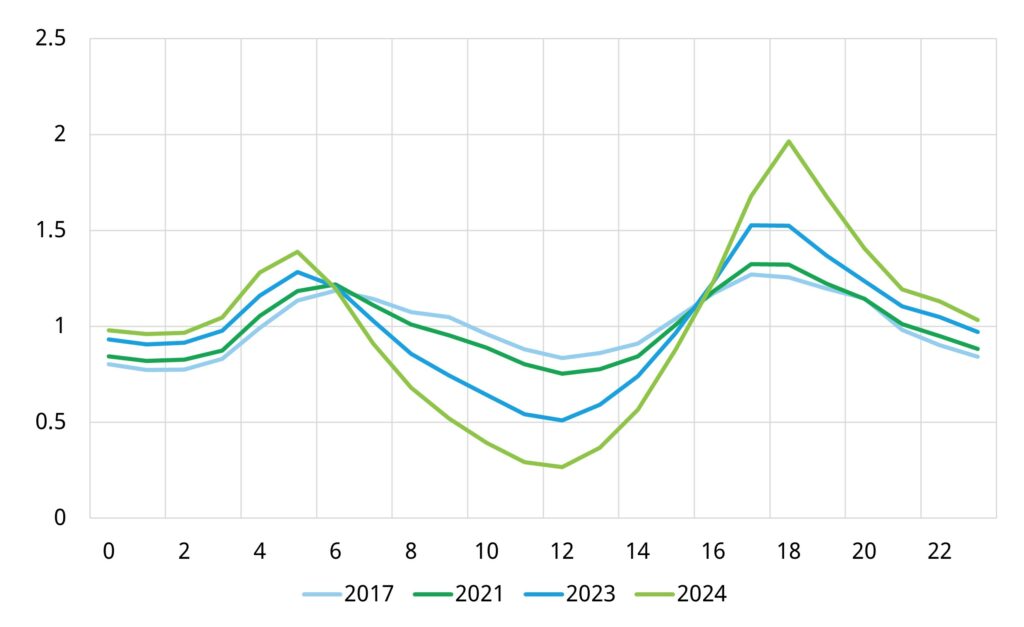
Source: EPEX
This chart is a classic practical illustration of the ‘duck curve’ impact of increasing solar penetration pushing down prices across the middle of the day (particularly across summer). Let’s dig a bit more into the factors behind the rapid increase in low / negative prices.
5 drivers behind negative German prices
In table 1 we summarise 5 factors that are driving the increase in incidence of negative prices.
Table 1: 5 drivers of growth in low / negative German prices
1 & 2 are the major structural drivers that will continue to increase the incidence of low / negative prices. 4 will ensure the impact of negative prices is transmitted across markets. Policy changes relating to 3 are likely to mean that going forward RES assets may not bid as deeply negative as currently. The impact of 5 is likely to decline and reverse over the next 5 years as demand recovers.
German ancillary prices rising given system challenges
The price impact of higher RES penetration is being felt in ancillary as well as wholesale markets.
Chart 5 shows a ‘heatmap’ view of FCR (left hand panel) and aFRR downwards (right hand panel) prices in Germany across 2024.
Chart 5: FCR (left) and aFRR downwards (right) pricing in 2024
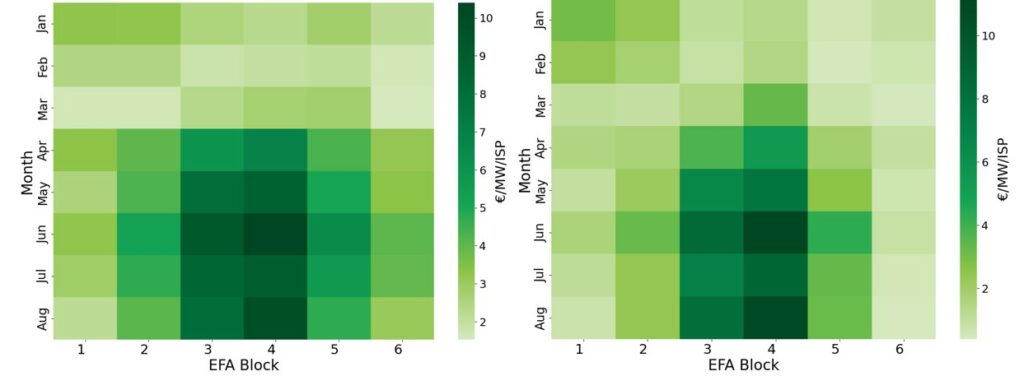
Source: ENTSOE
A combination of low residual load and high solar has led to higher FCR and aFRR prices across the middle of the day. Low prices mean generators which usually provide downward flexibility are not running, meaning ancillary services prices increase.
Generators e.g. CCGTs that usually provide services like downwards aFRR need higher compensation to run during periods of low or negative prices.
This is a key service that BESS assets will provide going forward. As BESS capacity grows ancillary prices signals are set to soften as these services get saturated. There are signs of this approaching e.g. In FCR there is already more BESS capacity prequalified than the average requirement for the service.
What do negative prices mean for BESS?
We show a German case study above, but the trends in play are relevant to power markets across Europe. These same trends are creating strong tailwinds for BESS investment. We finish our article today with 5 takeaways for BESS investors.
Table 2: 5 takeaways for BESS investors
The last driver reflects a key reality with BESS asset valuation: a lot of value (& risk) can sit in the left and right tails of the distribution of price & margin outcomes. Low & negative prices are a great example.
Timera launching Italian BESS investment product
The next 12 months is set to see a surge in Italian BESS investment. The first tenders for 15 year contracts under the MACSE support scheme are coming in 2025. Meanwhile the next round of Capacity Market auctions are approaching.
We are launching an Italian BESS investment package that includes:
- A comprehensive & flexible BESS investment tool with revenue projections to 2050, revenue distribution data (e.g. P10, P90), degradation & cycling data across multiple durations and all Italian zones
- Zonal Italian power market price, supply & demand projections to 2050
- A comprehensive Italian BESS investment case report covering:
- Italian market overview & BESS potential
Analysis of BESS demand growth to support RES integration & grid stability under the new Italian power market design.
- MACSE & Capacity Market insights
Commercial analysis of MACSE and Capacity Market participation for BESS, and the impact of those mechanisms on the business case from a risk-value perspective.
- Scenario analysis & market sensitivities
Timera’s Central market scenario for evolution of Italian power market, emphasising key BESS value drivers.
- Revenue projections & backtests
Analysis of historical BESS performance & revenue projections with zonal and nodal detail, highlighting energy arbitrage, ancillary services, and capacity payments.
For further details and a sample copy of the report, feel free to contact Alessio Cunico (Senior Analyst) alessio.cunico@timera-energy.com or Steven Coppack (Power Director) steven.coppack@timera-energy.com