“The risk is in the distribution — not the mean.”
As the GB power market becomes increasingly renewables-dominated, imbalance price risk is becoming one of the more commercially significant – and underappreciated – sources of portfolio uncertainty. In this article we explore what drives imbalance prices, how the risk profile is evolving, and why robust quantification of this risk is becoming essential for asset owners and investors.
What is system imbalance – and what are its 5 key drivers?
System imbalance arises when a market participant’s contracted positions diverge from their actual physical delivery. Every half-hour, NESO must balance aggregate supply and demand across the system, and the cost of doing so falls primarily on those whose positions contributed to the imbalance.
The imbalance price itself is derived from the marginal actions taken within the Balancing Mechanism (BM), specifically the most expensive action required to bring the system back into balance, once non-energy actions are stripped out. Being long or short the system at the wrong moment can therefore be expensive, and the exposure is inherently asymmetric.
The 5 key drivers of imbalance volumes are:
1. Wind forecast error — the largest single contributor, given the inherent unpredictability of wind output
2. Solar forecast error — particularly significant in summer, where embedded solar generation adds uncertainty to demand forecasts
3. Demand forecast error — broader uncertainty in consumption patterns compounds weather-driven generation variability
4. Plant and grid outages — unplanned outages create sudden, hard to anticipate imbalances
5. Thermal plant ramping — the finite ramp rates of gas and other thermal plant mean supply adjustments lag real time system needs.
Evolution of imbalance risk distribution
The spread between Day-Ahead and imbalance prices is a good barometer for imbalance risk. In Chart 1 we show the historical evolution of the distribution of this spread, as well as a distribution projection from our stochastic power market model.
Chart 1: Historical and projected distribution of Day-Ahead vs imbalance price spreads
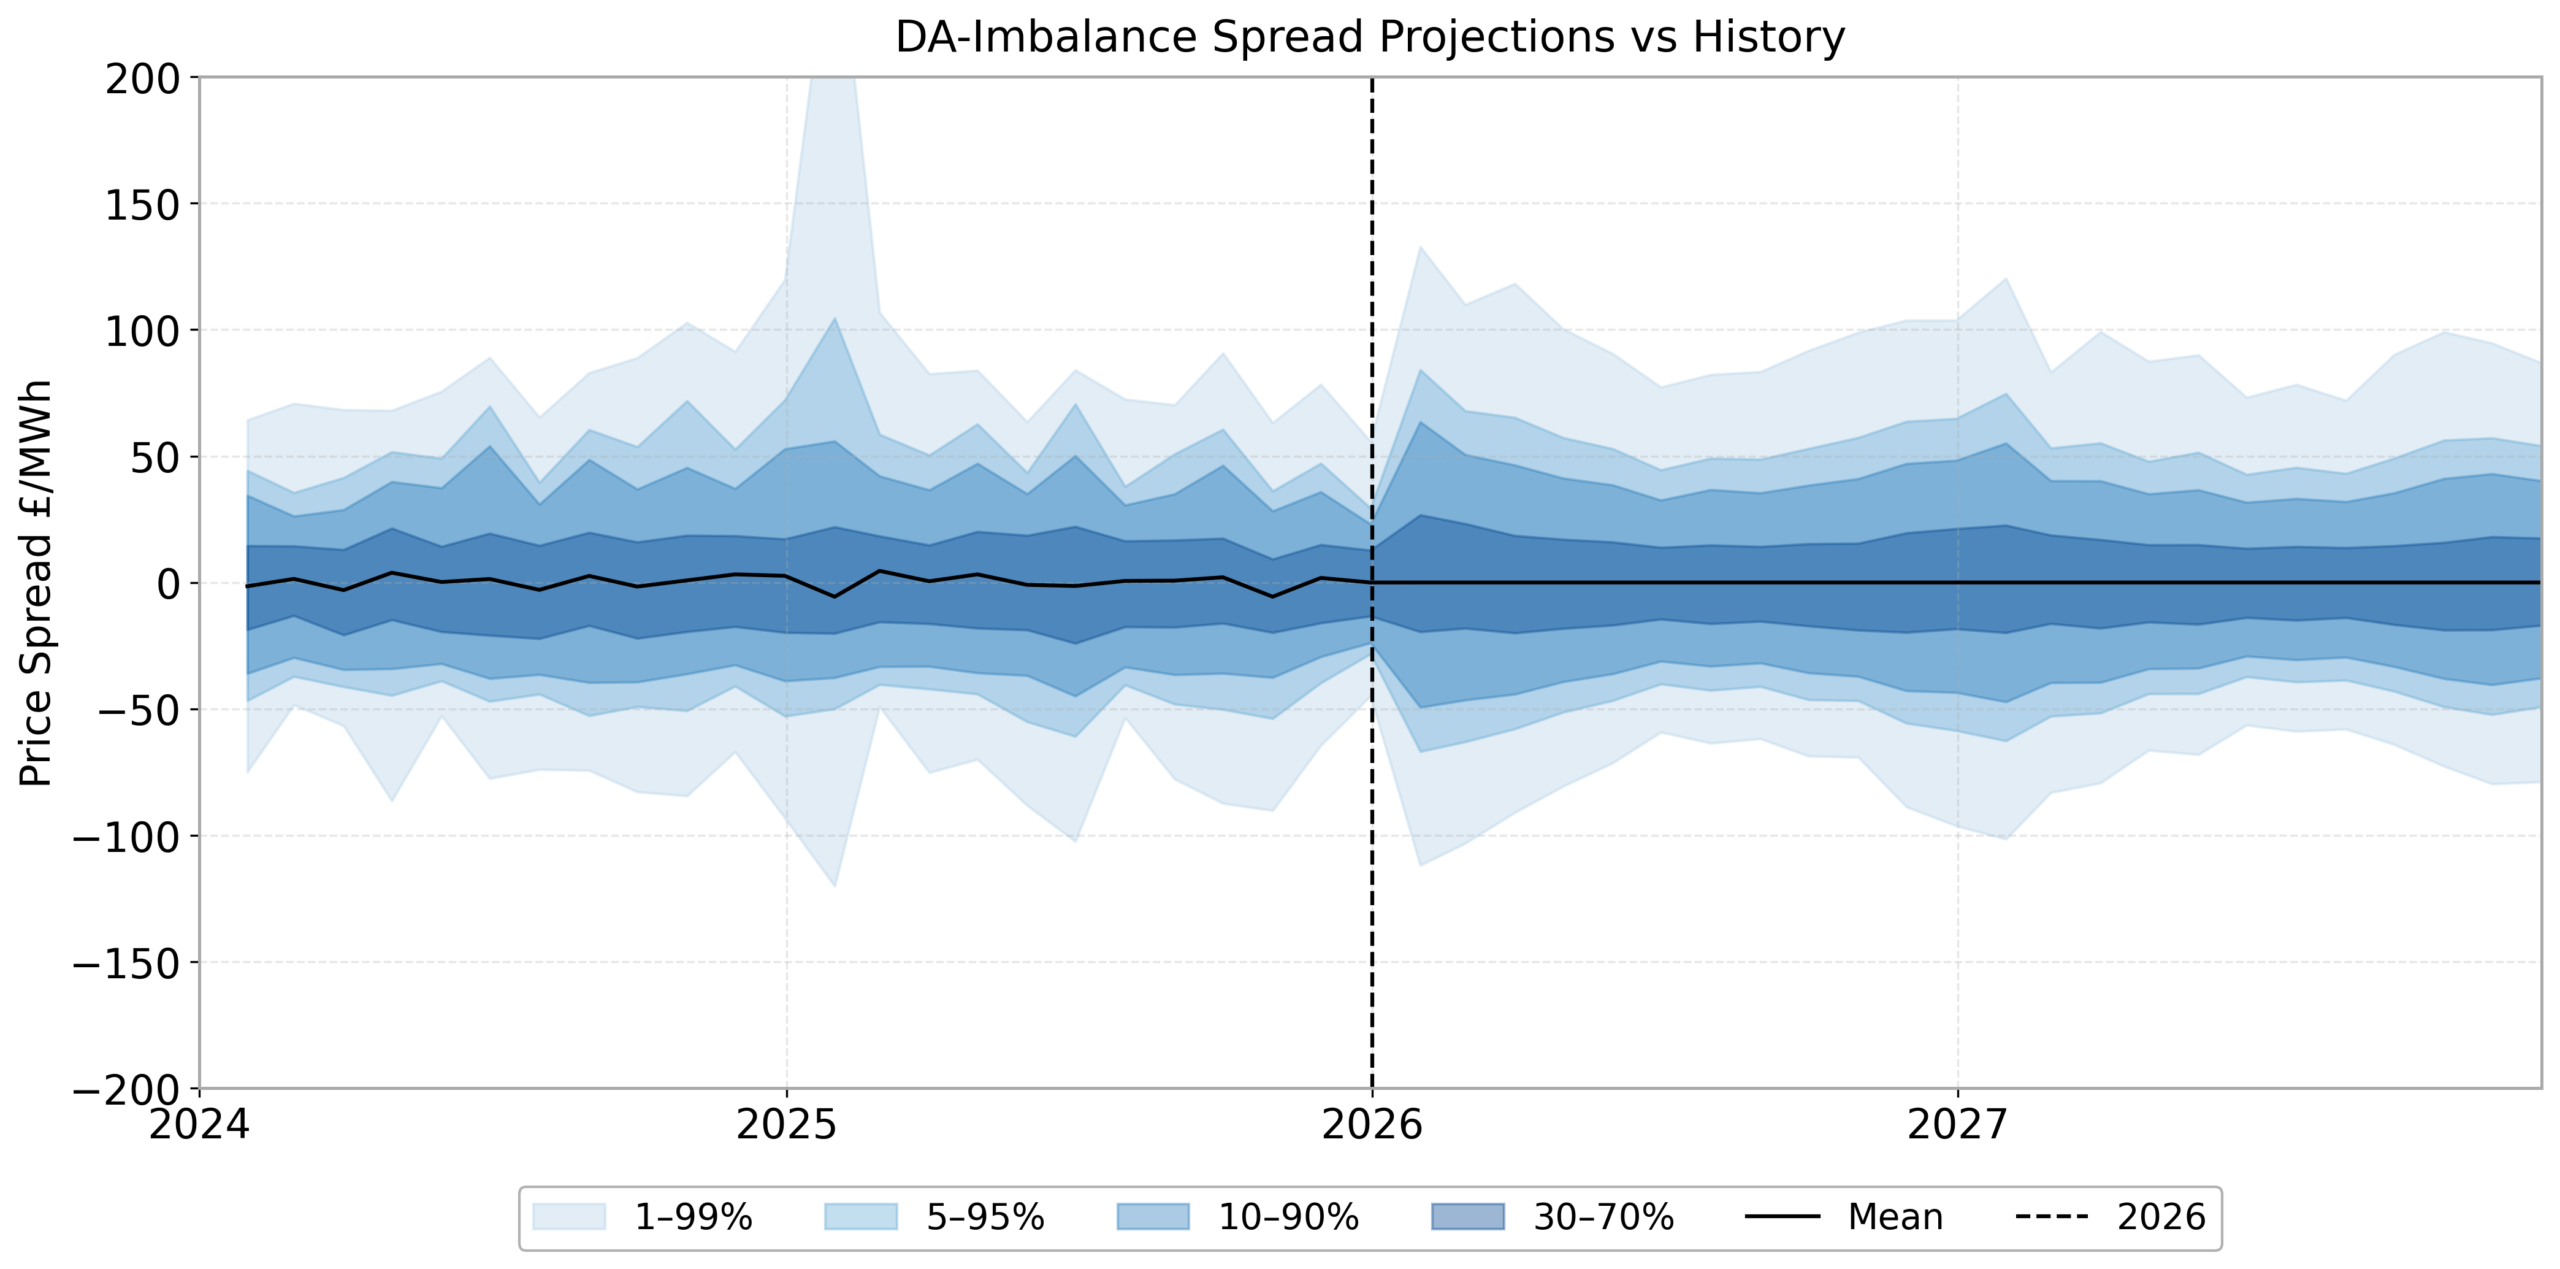
Source: Timera stochastic power market model
In Chart 2, we show how our modelling projects the distribution of Day-Ahead vs imbalance price spreads to broaden significantly from the mid-late 2020s (left panel) to the mid 2030s (right panel).
This increase in imbalance risk directly reflects the growing build-out of renewable generation alongside the ongoing retirement of dispatchable thermal capacity.
As the share of weather-dependent generation rises and the volume of flexible, controllable capacity falls, the system’s ability to self-correct in real time is reduced. The result is a fatter-tailed distribution of imbalance price spreads: benign conditions may look similar to today, but stress periods become more extreme.
Chart 2: Distribution of Day-Ahead vs imbalance price spreads — 2027–29 vs 2034–37
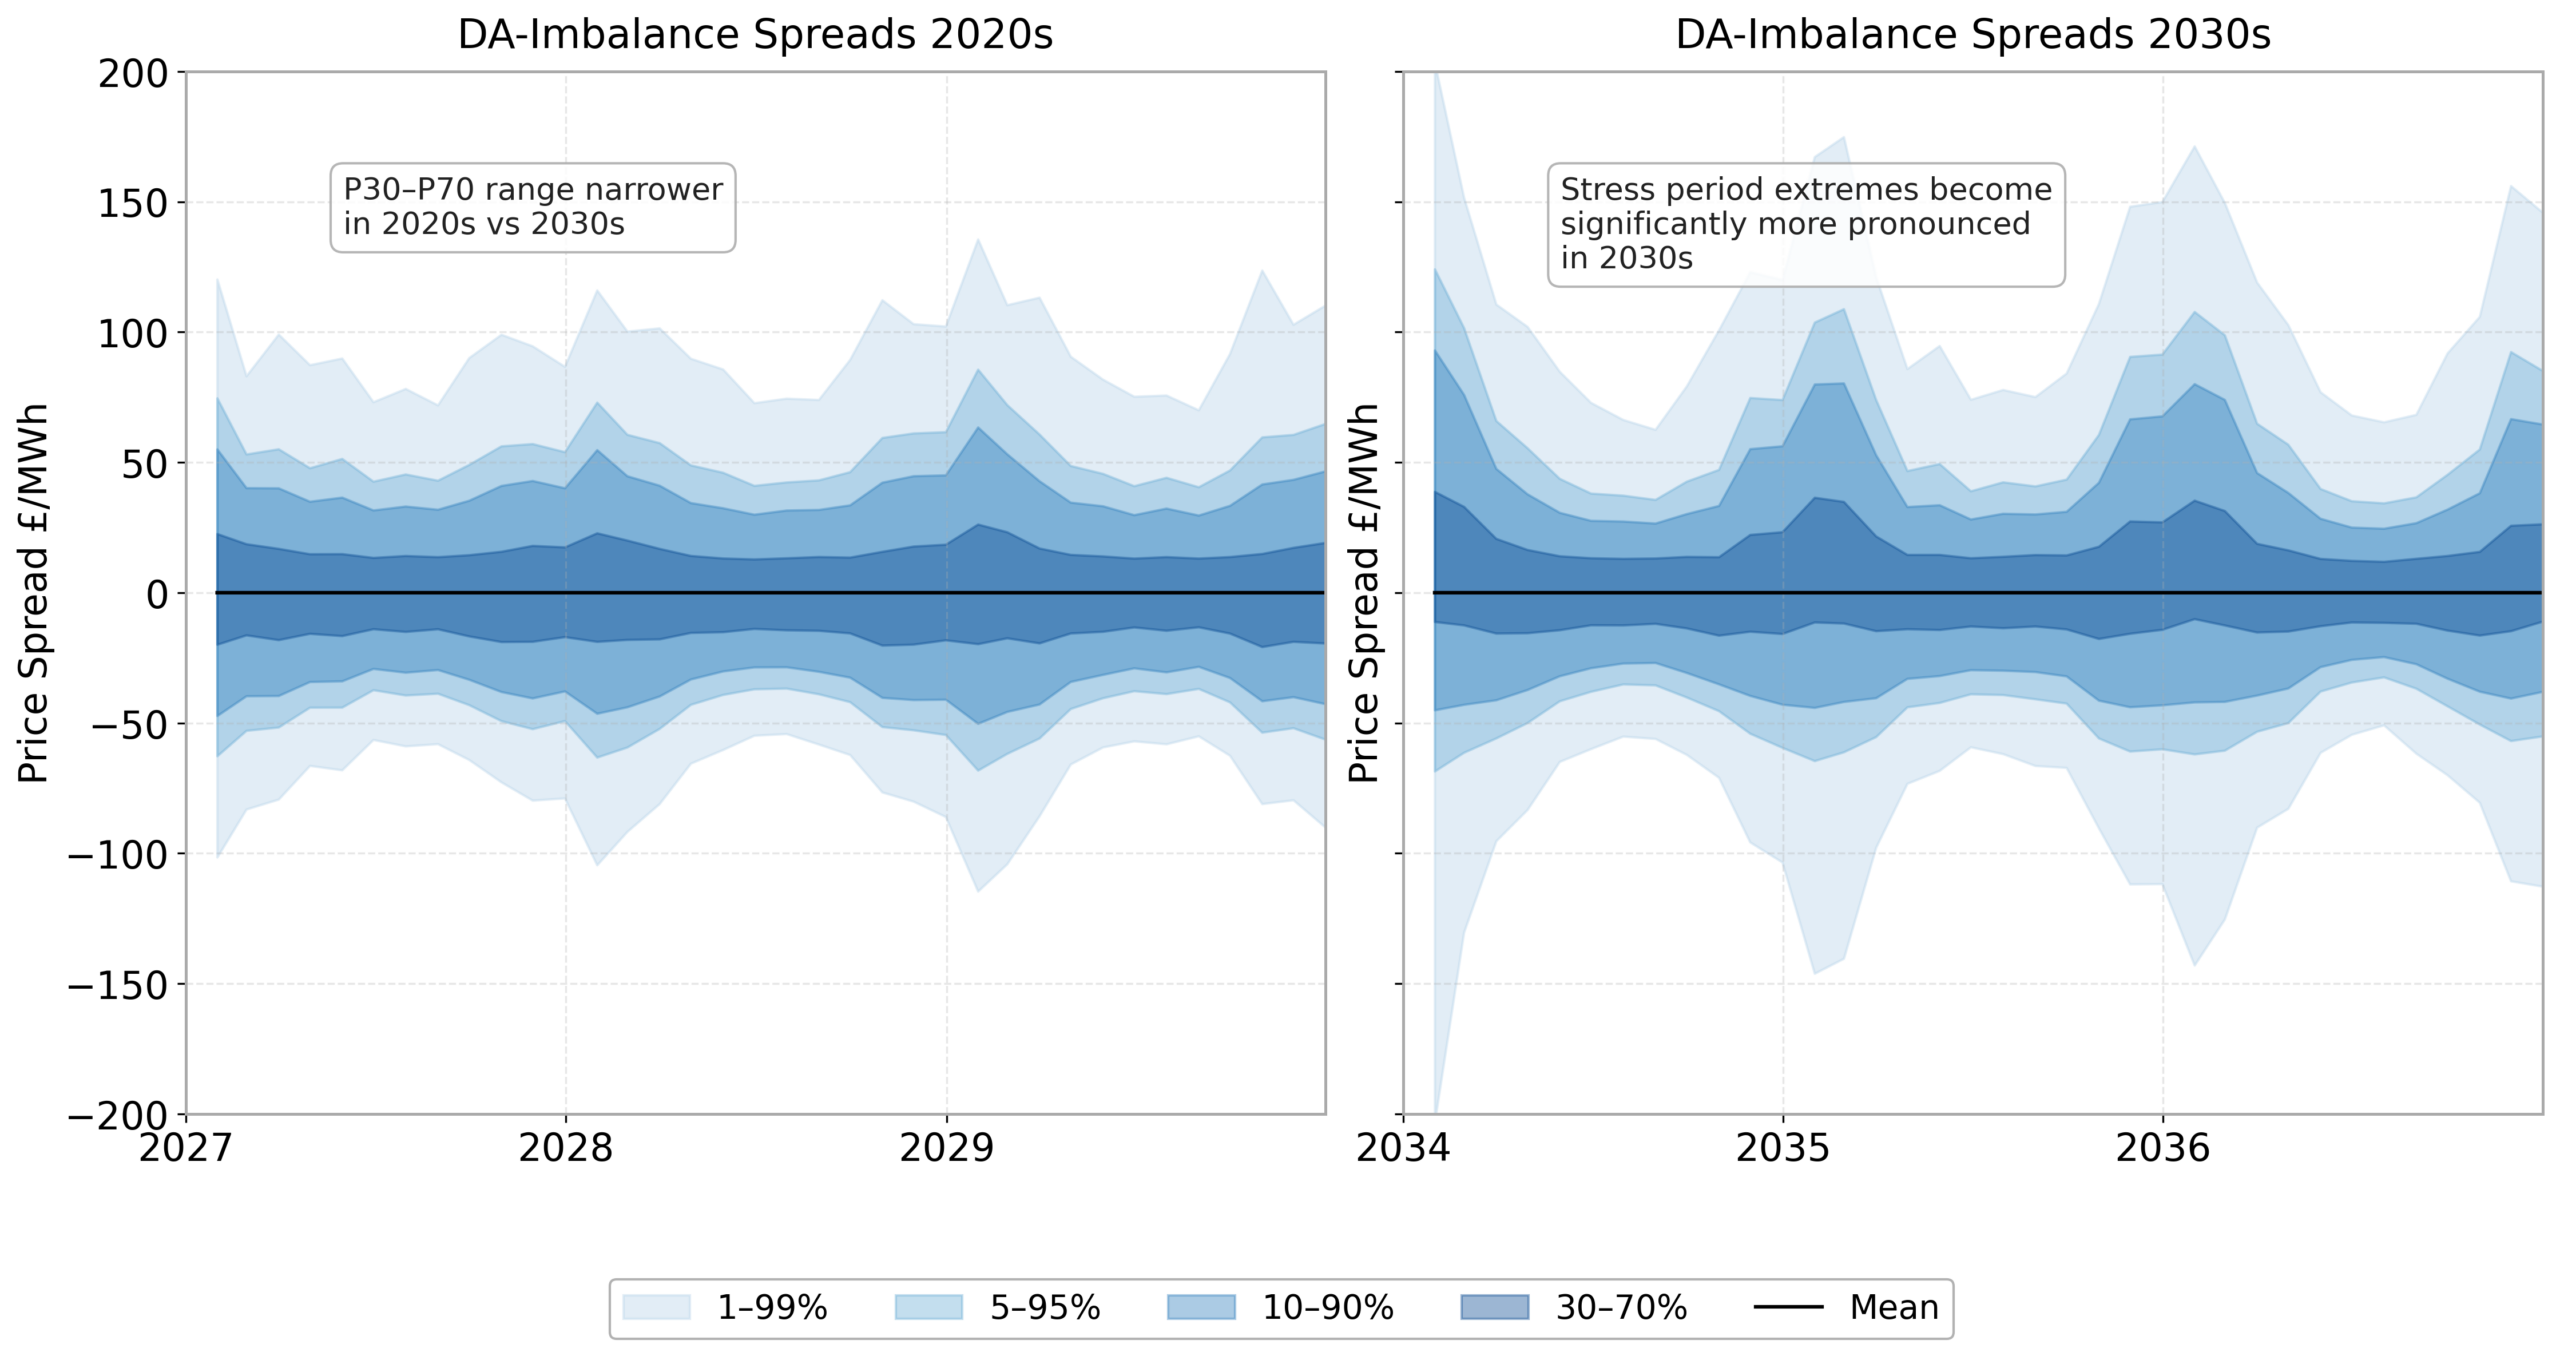
Source: Timera stochastic power market model
Looking further ahead into the 2040s, the picture shifts again. While the relative share of renewable generation remains broadly stable, the large-scale deployment of battery storage is projected to somewhat tighten the central range of imbalance price spreads vs the 2030s. Batteries are well-suited to rapid response and can absorb short-duration imbalance signals efficiently.
One feature that persists our modelled horizon is a zero average imbalance price spread. Any persistent bias in average spreads would create exploitable arbitrage opportunities, which competitive markets tend to erode quickly. The risk, therefore, is in the distribution – not the mean.
Why imbalance risk needs to be properly quantified
Imbalance is a key source of basis risk. The divergence between a participant’s contracted position and the realised imbalance price can have a material impact on portfolio returns, and the effect is amplified for assets with inherently higher forecast uncertainty.
Wind assets: exposure must be priced in
For wind assets in particular, volume uncertainty and imbalance exposure are structurally linked. Understanding the shape and magnitude of that exposure is essential to pricing contracting terms accurately, constructing effective hedging strategies, and protecting asset value. Getting this wrong – either by underpricing imbalance risk in a PPA or by over-hedging in a way that creates inadvertent imbalance exposure – can meaningfully erode expected returns.
Flexible assets: turning volatility into revenue
For flexible assets, the picture is different but equally important. Batteries, gas plants, hydro storage and demand response assets are not simply exposed to imbalance volatility – they are positioned to actively monetise it. The BM and imbalance settlement mechanisms represent a real revenue stream for assets that can respond rapidly to system stress signals. Quantifying that value requires a credible model of imbalance price distributions, not just a point estimate of Day-Ahead prices.
In a highly renewable system, BM optimisation value is structurally higher than in the thermal-dominated markets of the past. Flexible assets that understand and can respond to imbalance signals are positioned to capture premium revenues that inflexible generation simply cannot access.
The key takeaway
Imbalance price risk is not a niche operational concern – it is a core commercial variable in GB power markets. As the system continues its transition, the distribution of imbalance outcomes will become more extreme before storage deployment starts to stabilise it.
For asset owners, developers and investors, building robust imbalance modelling into investment cases and contracting strategy is no longer optional. It is table stakes for competing effectively in the market ahead.
Timera Energy provides quantitative analysis and advisory services across GB and European power markets. Get in touch with Arshpreet Dhatt (arshpreet.dhatt@timera-energy.com) to discuss how imbalance risk modelling can be integrated into your portfolio analysis.