The UK forward power market is in an interesting state of flux. It is difficult to price a commodity which has a value so heavily influenced by government policy intervention. Uncertainty around carbon price support and the introduction of a capacity market have eroded power market liquidity to the extent that some market participants are choosing to hedge forward power exposure through the more liquid NBP gas market, on the basis that the two commodities are strongly correlated. Despite poor market liquidity, indicative UK forward power pricing over a 3-4 year horizon paints an interesting picture of gas plant generation margins (spark spreads).
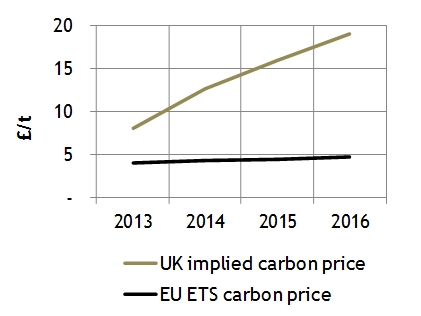
While uncertainty remains around the design and implementation of a UK Capacity Market, the government has provided some clarity on its carbon price support by publishing indicative carbon ‘top up’ numbers over a five year horizon in its 2012 budget. The carbon ‘top up’ is effectively a government generated premium to the EU ETS carbon price, a poorly conceived mechanism to support low carbon generation investment. The impact of the top up is to inflate the cost of carbon in the UK significantly above the current EU ETS forward curve as shown in Chart 1.
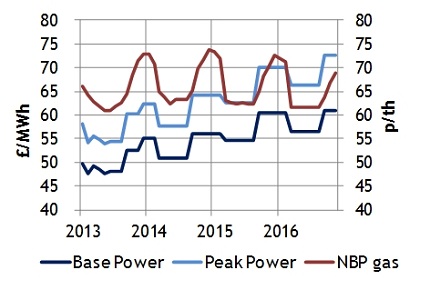
The impact of the UK carbon top up has been to drive a steep contango shape into the UK power curve. This effect is driven primarily by the anticipation of marginal gas plant pass through of the government’s carbon ‘top up’ into the wholesale power price. The NBP gas curve in contrast is relatively flat. These curves are shown in the Chart 2.
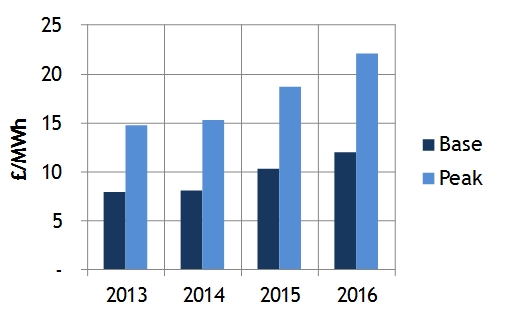
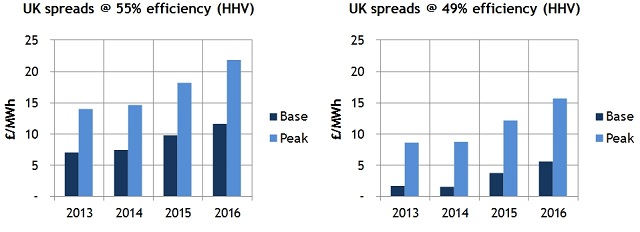
The carbon ‘top up’ numbers, combined with indicative forward power and gas pricing from the ICE, allow an estimation of forward UK spark spreads out to 2016. These are shown in Chart 3 for a latest generation CCGT (55% HHV efficiency) and for the market spread convention 49% efficiency unit.
Sceptics will argue that there is no liquidity behind the ICE power curves and that they therefore have no relevance as a forward price reference. It is true that a large majority of UK power transactions are conducted via the Over the Counter (OTC) market and that liquidity beyond 2015 is currently very poor. But the ICE quotes are in our view still a useful indicative price benchmark. They tend to move in line with OTC pricing and the pricing of structured power deals beyond a two year horizon. But indicative means just that – caution is justified.
With that caveat in mind, it is interesting to note a significant increase in sparkspreads in 2015-16 vs 2013-14. This coincides with what is expected to be a sharp tightening in the UK market capacity margin in the middle of the decade given a number of plant closures (e.g. LCPD coal/oil and older nuclear plant).
It is also interesting to note that, since the carbon top up numbers were announced in the budget in Mar 2012, Base spreads have fallen and Peak spreads increased. In other words, the market is pricing in more intra-day shape as marginal plant profiles change with an increase in renewable penetration (and coal plant remaining more competitive than gas).
While indicative market pricing appears to be showing signs of a recovery in spreads from mid decade, in our view it is too early to assume spreads are moving back to levels that will support CCGT new entry. We suspect Base spreads will remain below new CCGT recovery levels (~ 15 £/MWh) as long as existing CCGTs can fill the role of marginal source of flexible capacity provision. That is, it is cheaper to keep an existing CCGT running at low load factor to meet peak demand than build a new one. Times have been tough for owners of existing CCGT over the last 3 years, but there is light shining at the end of the tunnel.


