A new wave of flexible supply is transforming the LNG market. At least 200 mtpa of incremental supply is set to come online globally across 2025-29. Our global gas model shows the share of North American supply rising from 22% in 2023 to 34% by 2030 (volume growth of 116 mtpa).
This new wave of supply has important commercial implications for LNG portfolios. Large volumes of primary supply contracts are being signed & integrated into portfolios. Secondary market re-contracting of supply & flexibility is also gathering pace.
The North American export contracts which (along with Qatari volumes) are dominating new supply, feature significant embedded flexibility e.g.
- Option to divert gas across the Pacific vs Atlantic basins to capture highest value
- Option to cancel cargoes (if netback prices fall below variable costs).
Valuing these embedded supply contract options is currently a key focus across LNG market players. Options have both intrinsic & extrinsic value components. As the LNG market rebalances with new supply and prices ease, the extrinsic value of LNG contract flex options is increasing in importance and is more challenging to value & manage.
In this article we set out the key flex options within LNG portfolios, define intrinsic & extrinsic value drivers and use analysis of a case study US LNG supply contract to demonstrate how value is shifting with market changes.
Key types of LNG contract flexibility
In Table 1 we summarise 5 common categories of flex options that are commonly found in LNG supply contracts.
Table 1: 5 categories of LNG contract flexibility options
In our US toll case study below, we focus on two of these categories: (i) commodity volume flex in the form of cargo cancellation rights and (ii) locational flex in the form of cargo diversion rights.
Embedded options in price formulas, timing flex options and logistical flex options are also common in supply contracts. There are particularly important value dynamics in play currently in LNG contracts with oil-indexed exposure, given a sharp move higher in Brent relative to gas hub prices (e.g. JKM/TTF).
Intrinsic vs extrinsic value of flex options
Whatever the type of option, its value can be split into two components:
- Intrinsic value: the value of the option comparing its strike price against current market prices (e.g. forward curves)
- Extrinsic value: The difference between total market value of an option and its intrinsic value.
These value components are summarised in Diagram 1.
Diagram 1: Intrinsic vs extrinsic value
Extrinsic value reflects the potential for market volatility to increase the value of an option across remaining time to expiry. Extrinsic value is at its highest when the strike price of an option is at the same level as the underlying market price (i.e. when the option is ‘at the money’).
Let’s consider a simple example of a diversion flex option in a US supply contract. When the netback price spread between Asian spot prices (e.g. JKM) and European spot prices (e.g. DES NW Europe) is the same, the diversion flex option is ‘at the money’. Fluctuations (volatility) of the JKM vs DES NW Europe price spread can drive the option ‘in the money’ and increase its value.
Under the extreme market tightness of 2021-22, many embedded flex options in LNG portfolios had high intrinsic value and relatively limited extrinsic value (because the options were so far ‘in the money’). However as prices have eased in 2023-24 and the LNG market rebalances with the next wave of new supply, extrinsic value is becoming a much more important value driver.
This is driving many LNG companies to adapt their business models to invest more in the teams & capabilities required to value, monetise & manage risk associated with extrinsic value of flex options.
Let’s consider a practical example of flex option value in the form of a US supply contract.
US contract case study demonstrates flex value
The next wave of LNG supply is dominated by US supply contracts with a tolling structure. LNG under these contracts is typically US hub indexed with an additional variable liquefaction fee & a fixed annual tolling (or capacity) fee. Cargoes are sold on an FOB basis i.e. they are destination flexible.
The two most important flexibility options embedded in these US supply contracts are cargo cancellation flex and diversion flex. Value is strongly influenced by the prevailing levels of market forward curves, which drive the ‘in the moneyness’ of these options.
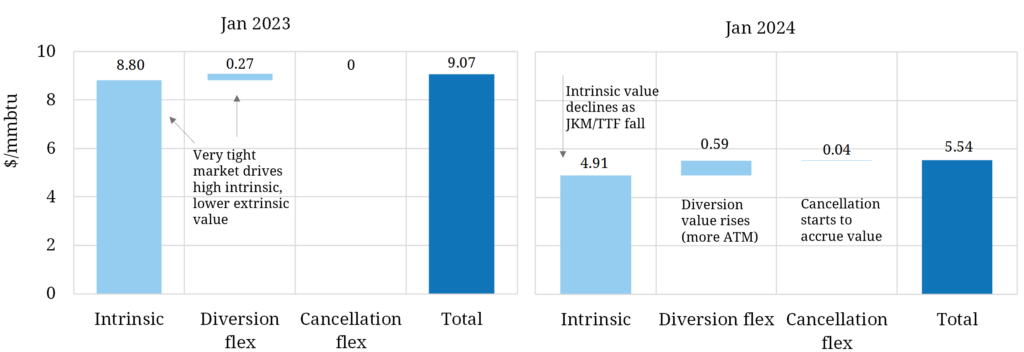
In Chart 1 we set out analysis of the value of a US supply contract in 2025, the year which marks the start of the next wave of new supply.
The left hand panel of the chart shows the value of the contract components in 2025, based on prevailing market forward curves in Jan 2023 (when the LNG market was still very tight). We break contract value down into intrinsic value and the additional uplift from diversion & cancellation flex options.
The right hand panel of the chart shows 2025 contract value breakdown based on prevailing forward curves a year later in Jan 2024 (capturing the impact of the substantial decline in forward curves across the last year).
Chart 1: Waterfall value breakdown of 2025 US supply contract value in Jan 2023 vs 2024
A summary of the analysis behind these charts:
- Analysis generated from our LNG Bridge portfolio model (used by a broad range of large LNG companies for valuation of LNG deals & portfolios)
- Left hand panel is based on market forward curves (e.g. Henry Hub, TTF, DES NW Europe, JKM & TC rates) from Jan 2023; right hand panel based on curves from Jan 2024
- For the purposes of this simple case study we have held other pricing parameters (e.g. volatility & correlations) constant across the two years.
There are some interesting conclusions from the analysis in the chart. Firstly there is a pronounced decline in intrinsic value of the supply contract from Jan 2023 to Jan 2024. This is a direct result of an easing in LNG market tightness, driving lower netback prices from Asia / Europe to US Gulf Coast.
The chart also illustrates the very low value of cancellation flex options in a tight market (Jan 2023) given strong netback price signals to export gas from the US. Sharp declines in JKM & TTF across the 12 months to Jan 2024 have caused US netback prices to fall, resulting in some increase in the value of cancellation flex. Note if prices decline further as new supply comes to market across 2025-29, the value of cancellation flex options may increase materially.
The value of diversion flexibility across the two years is a bit more nuanced. Diversion flex value is driven by the level and volatility of Asian vs European price spreads (i.e. JKM vs DES NW Europe). In Jan 2023 (left hand panel) forward markets were pricing high European netbacks to the US across 2025, contributing to high intrinsic value of the contract. As the market tightness has eased across the last 12 months, European netbacks have declined to similar levels versus Asia i.e. the diversion flex option is more ‘at the money’ and extrinsic value has increased accordingly.
5 key takeaways on LNG portfolio value
The relative shifts in value from early 2023 to early this year, provide an insight into what is coming as the LNG market rebalances with large volumes of new supply across 2025-29.
New supply is set to erode the price spread between Asian / European and US price levels. This will have some important implications for flex options within LNG portfolios:
- The intrinsic value of US supply contracts is set to fall as global prices converge (JKM/TTF fall vs Henry Hub)
- The relative contribution of extrinsic value of supply flex options is set to rise, and with it the importance of being able to value & manage embedded option flex
- Cancellation flex options are becoming more valuable as netback prices to the US decline with new supply
- Diversion flex options are increasing in value as intrinsic value of US supply contracts declines, with diversion value driven by JKM vs DES NW Europe spread dynamics
- LNG portfolio valuation, optimisation & hedging is becoming more complex driving a focus on investment in commercial & risk teams and associated analytics, data & system capabilities.
The rapid moves in market conditions that the LNG market is experiencing this decade are generating unprecedented value creation opportunities. The flip side of the coin is that market moves also drive substantial risk.
The effective negotiation, valuation & management of supply flex options within LNG portfolios can play a key role in capturing portfolio value & managing risk.
Interested in more information?
We would be happy to provide more details on:
Feel free to reach out to our LNG & Gas Director David Duncan for further details (david.duncan@timera-energy.com).


