Small reciprocating engines are dominating delivery of new capacity in the UK power market. 3.5GW of engines have so far been successful in the UK’s T-4 capacity auctions (2014-16). Engines behind the meter have been the main source of another 2.1 GW of successful DSR capacity.
However since the 2016 capacity auction, a policy shift to remove the key triad revenue benefit has forced a major transition in engine economics. The engine investment case has shifted to focus on margin capture from wholesale and cash out price volatility.
A shift in business model
Triad revenues were effectively a regulated annual revenue stream (albeit with policy risk attached). Peaker developers have plugged the triad gap by pursuing a merchant business model focused on extrinsic value capture from gas engines. That means a substantial shift in investment risk/return profile.
Rather than being scared off by this merchant risk profile, ‘alternative infrastructure investors’ are currently engaged in a fierce battle to try and dominate gas engine investment. As a result, gas engines are again set to play an important role in the UK’s next T-4 capacity auction starting this week.
This enthusiasm is supporting some very optimistic forecasts of peaker margin evolution. It is one thing to forecast peaker returns in a cashflow model. It is quite another thing to turn those forecasts into realised margin on a trading desk.
In today’s article we summarise how trading desks practically generate margin from gas engines. We also quantify gas engine margin capture against historical market prices as a way of benchmarking returns.
Practicalities of peaker value capture
Traders optimise gas engine margin capture based on a series of sequential activities in the following four markets through to delivery:
- Forward markets
- Day-Ahead auction
- Within Day market
- Balancing Mechanism & cash out prices
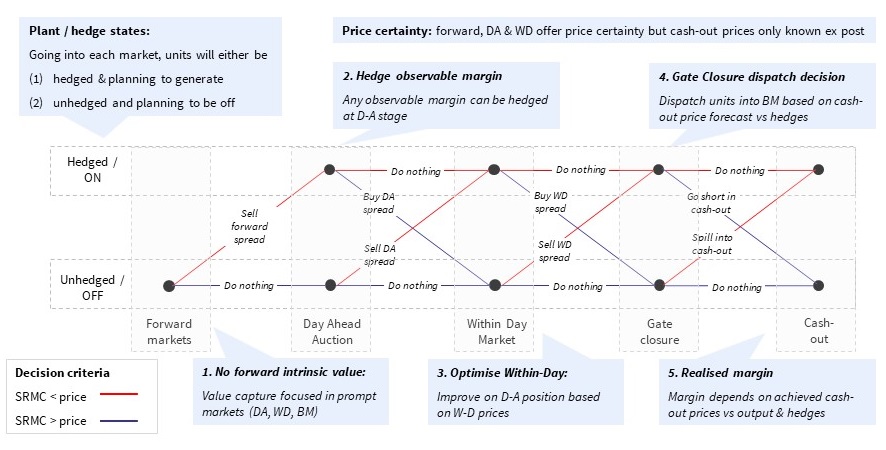
Margin capture activities are summarised in Chart 1. This assumes a ‘cash out’ price chasing strategy which is currently the most common approach to margin capture. This strategy can also interact with margin capture from ancillary service markets (e.g. STOR), but we do not consider this in the diagram for simplicity.
Gas engines typically have very little margin that can be hedged in forward markets (intrinsic value), given relatively low unit efficiencies (35-40% HHV).
Margin capture instead usually starts with the day-ahead auction. Here certain peak hours may be hedged (particularly in the winter). But day-ahead margin capture is still relatively low as a portion of total margin.
Within-Day margin capture is also typically quite limited. This is because of a high correlation between day-ahead and within-day prices and limited within-day liquidity.
That leaves the Balancing Mechanism (BM) as the main source of margin. BM margin capture is focused on a ‘cash out price chasing’ strategy that relies on forecasting cash out prices as follows:
- Spill: If cash out prices are correctly forecast to be higher than unit variable cost, then units are ‘spilled’ into the BM to be cashed out profitably.
- Turn off: If cash out prices are correctly forecast to be lower than the price of any existing hedges, then units can be switched off and the hedges cashed out.
The success of gas engine margin capture therefore largely depends on (a) the volatility of cash out prices and (b) cash out price forecasting error (since errors cost money).
An alternative to the ‘cash out price chasing’ strategy is direct BM participation for engine units. But this requires significant set-up costs, takes volume control away from the generator and results in direct competition from other generators (e.g. CCGTs).
Quantifying margin capture
The robust projection of gas engine margin requires a modelling framework that captures the sequential activities above. Importantly it needs to properly account for the uncertainty that trading desks confront across the activities required to monetise units. Overly optimistic forecasts of gas engine margin are typically the result of analytical shortcuts or a lack of practical commercial rigour.
We will come back to margin modelling approach in the future. But to provide an objective margin benchmark for today’s article, we have done a simple historical back-testing of gas engine performance against day-ahead and cash out prices since the start of 2016.
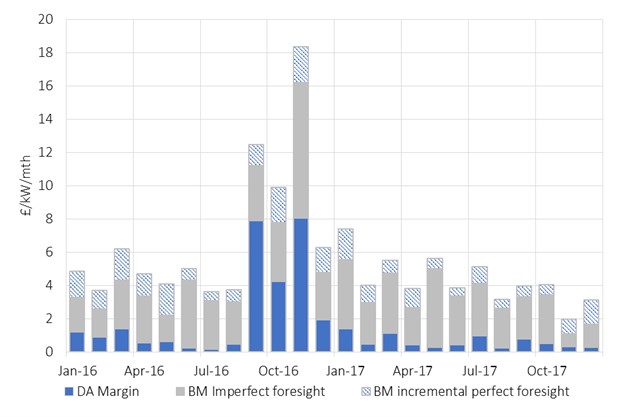
Chart 2 shows gas engine margin capture against the day-ahead auction (bottom blue series). Above this we show two scenarios for cash out margin capture:
- Rule Based: The grey bars in the chart show BM value capture assuming cash out price uncertainty. Margin capture is based on a forecast of cash out prices generated from a range of variables at Gate Closure (e.g. estimated system imbalance volumes, wind variability).
- Perfect Foresight The blue hashed bars show the incremental value capture (above the Rule Based approach) assuming 100% accuracy in forecasting cash out prices. Although this is unrealistic, it gives an upper bound.
The Rule Based approach implies the capture of 75-80% of perfect foresight value (consistent with benchmarks of actual peaker value capture).
A specific set of events drove the more extreme margins across Win 16-17. Major French nuclear outages reversed flows on UK interconnectors, creating very high prices & volatility. This was compounded by the SBR scheme (now defunct), which effectively removed a large volume of reserve capacity, acting to further tighten the market.
Unless you are a very optimistic generator, the events of last winter were outliers. Realised energy margins since then have settled mostly within a 30-50 £/kW/yr range (based on the Rule Based approach), and are falling across the current winter. These margin levels a significant discount to some of the more optimistic projections underpinning peaker investment cases.
Looking ahead there is also considerable uncertainty as to how cash out margins will evolve. There are currently only several hundred MWs of gas engines chasing prices. Step forward 5 years and that is likely to be several GWs. This raises a clear risk of margin erosion. It may also increase cash out price forecasting error.
Large volumes of capacity choosing to take cash out price exposure also goes against the original principles of the NETA trading arrangements (i.e. self-balancing and driving liquidity into the voluntary markets ahead of Gate Closure). This raises the risk of policy driven rule changes aimed at curbing cash out price chasing.
Gas engines here to stay… but not earning super rents
Gas engines will remain a competitive source of capacity for a number of years to come. Their role in providing capacity is underwritten by low capex, high flexibility and the benefits of distribution connection. But the barriers to new entry are relatively low, suggesting competition will drive out any structural margin rents.
Margin exuberance from a subset of investors and developers is setting up painful asset value write-downs by early next decade. This is likely to support the peaker consolidation trend already underway.
Portfolio aggregation is set to ensure that gas engine investment is dominated by several larger players with a competitive cost of capital, a robust understanding of merchant exposure and a strong commercial capability to monetise it.