Featured
March 22, 2021

Carbon driving gas, power & LNG prices higher

5 min

Subscribe to our blog

European gas prices are driven by the competitive dynamics between gas and coal plants. As a result, the 80% surge in carbon EUA prices since Nov-20 is pulling European gas curves higher.  European power & Asian LNG prices are following suit, given they are anchored by TTF.

“As carbon prices have surged in 2021, lignite & coal plants are competing to set switching levels…

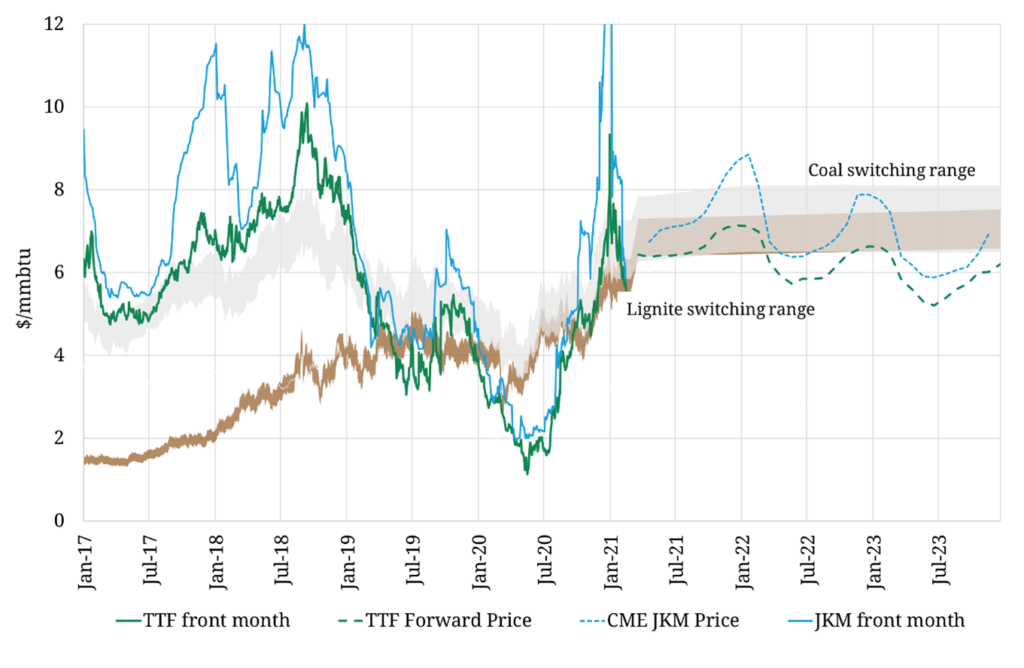
…driving TTF & JKM prices higher”

As carbon prices rise, coal fired plants become less competitive relative to CCGTs.  This supports gas fired generation, increasing gas demand and causing upward pressure on hub prices.

Switching levels, at which tranches of coal fired plants displace gas, act as a key driver of TTF pricing dynamics. But switching levels are a moving target. As coal & carbon prices have increased in 2021, switching levels are also marching higher.

In today’s article we look at the impact of rising carbon prices on switching levels and gas prices. We also set out why the sensitivity of TTF to rising carbon prices is increasing in 2021.

What is going on with carbon prices?

Carbon prices have risen at a blistering pace across the last year. EUA prices are up 190% from the Covid low (last Mar), 80% since last Nov and more than 30% this year, currently trading around 42 €/t.

Increasing prices are a market reaction to a concerted EU policy push to ramp up emissions reductions.  This was reflected in the increase in 2030 emissions target to 55% (vs 1990) in Q4 2020, as well as ongoing discussions to further ramp up reductions.

Part of the move higher in EUA prices has been driven by a surge in demand from non-compliance entities, loosely termed as ‘speculative buyers’.  This for example includes funds & financial institutions ‘front-running’ compliance demand (e.g. from power generators) in the anticipation of selling for a profit into rising prices across Phase 4 (2021-30).

There is also evidence of compliance buyers (e.g. European utilities) purchasing EUAs on a forward basis to try and lock in positive margins on coal & lignite assets.

Despite the current momentum behind carbon prices, a continuing surge is not a one-way bet.  Rising carbon prices are pushing forward generation margins on coal & lignite plants into negative territory, which will likely induce generators to unwind EUA hedges. There are also potential headwinds from UK buyers unwinding EUA positions once the UK ETS offers a viable alternative.

But whether rising or falling, carbon prices are having a substantial impact on European gas prices (and in turn power prices).

Switching levels driving up TTF

Chart 1 shows current forward market implied switching ranges for coal & lignite plants, as well as their historical evolution. The Coal Switching Range (CSR) is show in grey and the Lignite Switching Range (LSR) in brown.

Chart 1: TTF versus coal & lignite switching ranges

Source: Timera Energy


Back in 2018, lignite plant costs were largely irrelevant for the gas market. It was hard coal plant switching ranges that anchored European gas prices.

That is no longer the case in 2021, given the rapid rise in carbon prices. Although a lot of the mining & operational costs of lignite plants are fixed, there is a variable cost component (consisting increasingly of EUA costs). As lignite plant variable costs are rising with carbon prices, lignite plants are being displaced by CCGTs.

This can be seen in Chart 1, with the brown Lignite Switching Range moving up this year to overlap with the bottom of the Coal Switching Range.

Lignite switching is important because it magnifies the impact of carbon prices in driving gas prices.  The higher carbon intensity of lignite plants results in around double the variable cost sensitivity to EUAs versus hard coal.  For example a 1 €/t move in the EUA price causes around a 0.45 €/MWh move in the LSR compared to a 0.25 €/MWh for CSR.

As carbon prices have surged in 2021, the LSR (brown band) has moved up to overlap with CSR (grey band), which means that lignite plants and coal plants are competing directly in the stack.

TTF gas curve tells the story

The increasing influence of carbon prices and lignite switching dynamics can be seen in Chart 2, which shows the TTF forward curve (i) at the start of Jan 2021 vs (ii) end of Feb 2021 vs (iii) last week.

Chart 2: TTF curve evolution in 2021 (Jan vs Feb vs Mar)

TTF prices in early Jan were influenced by the spike in Asian LNG prices and the diversion of European cargoes to Asia.  That influence has now receded as market tightness has eased and JKM has reconverged with TTF.

The significant move up in the TTF curve since the end of Feb 2021 (the blue dashed line), has been primarily driven by rising carbon prices.  Carbon prices have increased by ~5EUR/t since then, which translates to a ~2.25EUR/MWh rise in lignite switching levels. Chart 2 shows that this is consistent with the move higher in TTF prices.

The move higher in TTF has also directly translated into higher JKM prices. The Winter 2021-22 JKM contract is now trading around 8.20$/mmbtu, partly reflecting the higher TTF curve, but also an increasing risk premium around higher charter rates (given the experience of Jan 2021).

Finally let’s consider European power prices. Carbon is acting in two ways to drive power prices higher. Gas, coal & lignite plants are directly passing through EUA costs when setting marginal power prices.  But with CCGTs dominating power price setting across Europe, the impact of carbon on gas prices is also an increasingly important secondary factor pushing power prices higher.

Carbon driving gas, power & LNG prices higher