‘Positive baseload generation margins for German CCGTs? That’s not possible!’
Exclamations such as this have echoed across European power markets this summer. At the start of 2016, the concept of CCGTs displacing coal plants in the merit order was off the radar. Raising such an idea in front of a Risk or Investment Committee in January would have raised sceptical eyebrows. Yet CCGTs all over Europe are back in action this summer… for the moment anyway.
We set out the logic behind why we thought gas vs coal switching was going to be a key mechanism for clearing surplus gas at European hubs in an article this spring. This summer’s revival in European CCGT load factors is an illustration of gas vs coal switching in action. Across Europe we estimate up to 40 bcma of potential CCGT switching demand as gas prices fall.
Germany is arguably Europe’s most hostile power market for CCGTs given the dominance of cheap coal and renewables. So in today’s article we focus on the German market to illustrate the drivers behind the sudden shift in competitive balance that has taken place between gas and coal plants. But the logic extends across all European power markets.
Plant margins & fuel prices: a summer 2016 case study
Enormous energy is exhausted attempting to conquer the fundamental modelling of European power markets. The basic techniques of supply stack modelling have hardly evolved over the last 20 years. But the evolution of processing power and data management have enabled the complexity and granularity of power market modelling to increase exponentially.
These developments have led to the insightful analysis of factors such as the impact of a strong breeze at 03:30 on Sunday the 29th January 2037. But behind the overheating processers and ever expanding databases a simple fact remains: power plant margins are predominantly driven by the relative behaviour of fuel prices.
Summer 2016 is a good example of this and you don’t need a complicated power market model to understand it. Chart 1 illustrates the recovery in baseload German clean spark spreads (CSS) so far this summer. Baseload CSS has risen from around -8 €/MWh in May to over 3 €/MWh by the end of August. That is an increase of more than 10 €/MWh in the space of three months. Over this period, coal plant generation margins (CDS) have remained at close to zero levels as coal plants dominate marginal price setting.
On a forward basis baseload spark spreads decline back into negative territory. However peak German spreads remain positive across the coming winter.
Chart 1: German baseload coal and CCGT generation margins (CDS and CSS)
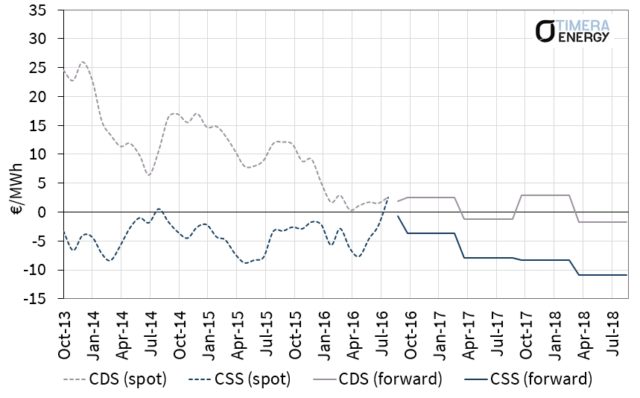
Source: Timera Energy (gas efficiency 49% HHV, coal efficiency 36%)
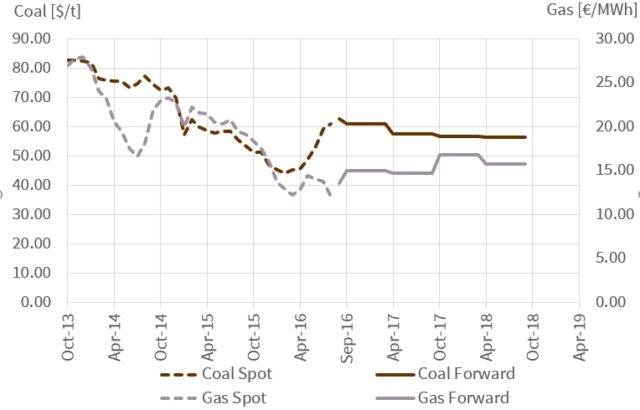
Chart 2 shows the primary cause of the recovery in CCGT margins, a pronounced shift in relative gas versus coal prices.
Let’s consider this relative fuel price shift a leg at a time. European gas hub prices have come under renewed pressure across the last quarter. Owners of oil-indexed gas contracts have been strongly incentivised to take high volumes of gas given 6-9 month price lags which are capturing the low Brent prices from the start of 2016. In addition, summer gas demand for storage injection has been relatively subdued, with the UK’s Rough storage out of action and healthy Continental storage inventories. A gradual flow of LNG cargoes continues into North West European hubs, although Europe has so far not yet felt the fuller impact of surplus LNG as ramp up issues have continued with several new LNG liquefaction projects.
In sharp contrast, global coal prices have undergone a pronounced recovery across Q2 and Q3 2016. As usual with the coal market, China is in focus. There have been ongoing cutbacks in Chinese coal production in response to overcapacity. These have been reinforced by temporary weather related issues such as unusually hot weather (boosting coal-fired power demand) and heavy rain (impacting coal production). A tightening in the Pacific Basin coal market has boosted Atlantic Basin prices as European buyers need to compete for supply.
The shift in relative fuel prices has been reinforced by poor nuclear availability in the French power market this summer, which has supported healthy German exports.
Looking beyond this summer – what is happening with forward prices?
The recovery in prompt CSS has not lifted forward baseload spark spreads into positive territory (forward CSS can be seen around -5€/MWh across Winter 16/17 in Chart 1). The current downward slope of the forward spark spread curve is driven by two factors:
- Gas curve contango: there is a pronounced upward slope to European gas hub curves, in sympathy with Brent curve contango
- Coal curve backwardation: the coal curve remains in backwardation, reflecting an anticipated easing in the conditions that have tightened supply over the last few months
Gas curve contango reflects a market anticipation that the pronounced oversupply of Summer 2016 is a temporary phenomenon that will ease into the coming winter. This is reinforced by the upward pull that oil-indexed gas contracts exert on European gas forward curves, as the 2016 oil price recovery feeds through into contract prices and the Brent curve remains in contango. Coal curve backwardation on the other hand reflects an anticipated easing in the conditions that have tightened supply over the last few months.
It is however important to note that the forward spark spread curve is not a good forecast of future spot spreads. If you are not convinced you can find evidence in animation here and an explanation of the logic behind this here.
What factors are likely to determine the evolution of European generation margins going forward?
One important factor is that coal plants remain the dominant setter of Continental power prices. That can be seen in Chart 1 via the relative stability in German generation margins (CDS) across 2016 i.e. power prices are moving in a correlated fashion with coal prices. This means that further falls in gas hub prices (or rises in coal prices) will translate into higher spark spreads. So if spot gas hub prices remain weak (rather than recovering in line with gas curve contango), this will support the CCGT margin recovery story.
There are two drivers worth watching as an indication of further weakness in European gas hub prices over the next 2 – 3 years:
- LNG imports: The volume of surplus LNG that flows into Europe as new global liquefaction capacity ramps up, will play an important role in determining whether hub prices recover back towards oil-indexed benchmarks.
- Henry Hub: The US gas market represents important price support for European hubs, with Henry Hub dynamics increasingly linked to European hubs by the hedging and optimisation of US LNG export volumes.
The recovery in CCGT margins and load factors will likely ease into the coming winter given seasonal gas price shape. But the events of Summer 2016 illustrate the growing importance of gas vs coal switching in clearing an oversupplied European gas market.
We have focused on Germany this week as the last cab off the rank when it comes to CCGT margin recovery. The story for CCGTs in other Continental power markets improves with the power price spread over Germany. But the UK power market is a clear first cab off the rank. The impact of relative fuel price shifts on UK CCGT margins has been magnified by an anaemic system reserve margin and gas plants returns have taken off this year. We return to focus specifically on the situation for generation margins in the UK next week.
Article written by David Stokes and Olly Spinks