It is hard to understate the importance of the Japan-Korea Marker (JKM) as a market price signal. It is a key barometer of the state of balance in the LNG market and cargo flow volumes into Asia vs Europe. But JKM is also evolving into an important reference point for contracting & hedging portfolio exposures.
“Strong Asian LNG demand is driving a premium of JKM over TTF signalling the diversion of US & North Atlantic supply from Europe”
JKM liquidity has evolved rapidly across the last 3 years. Growth in spot trading liquidity has seen JKM increasingly used as the basis for physical trades (both in and outside Asia) as well as increasingly a contract reference point for derivatives (e.g. JKM swaps) and even medium to longer term supply contracts.
Our focus for today’s article is to explore the market dynamics that drive the JKM price level.
Asia vs Europe: some key differences
JKM generally acts as a satellite price to the more liquid European benchmark TTF gas hub price. This linkage is driven by the large volumes of flexible LNG supply that can arbitrage structural price differences across Europe & Asia (particularly US exports).
However the JKM / TTF relationship can break down across shorter periods, sometimes spectacularly as we saw when Asian buyers were caught short LNG across a prolonged cold period last winter (with North Asian cargos trading up to 40 $/mmbtu). The break in JKM / TTF linkage is typically driven by shipping & logistics constraints that can be hard to alleviate across a window up to 3 months ahead of cargo delivery.
Asian LNG demand is less flexible than European gas demand, which has large volumes of price responsive coal-gas switching flexibility in the power sector.
On the supply side, Asian LNG importing countries have limited gas storage capacity. European supply flexibility on the other hand is supported by 100 bcm of working gas storage volume and significant pipeline supply contract flexibility.
Limitations in domestic market supply & demand flexibility, mean that Asia relies strongly on LNG market flexibility.
What dynamics drive JKM pricing?
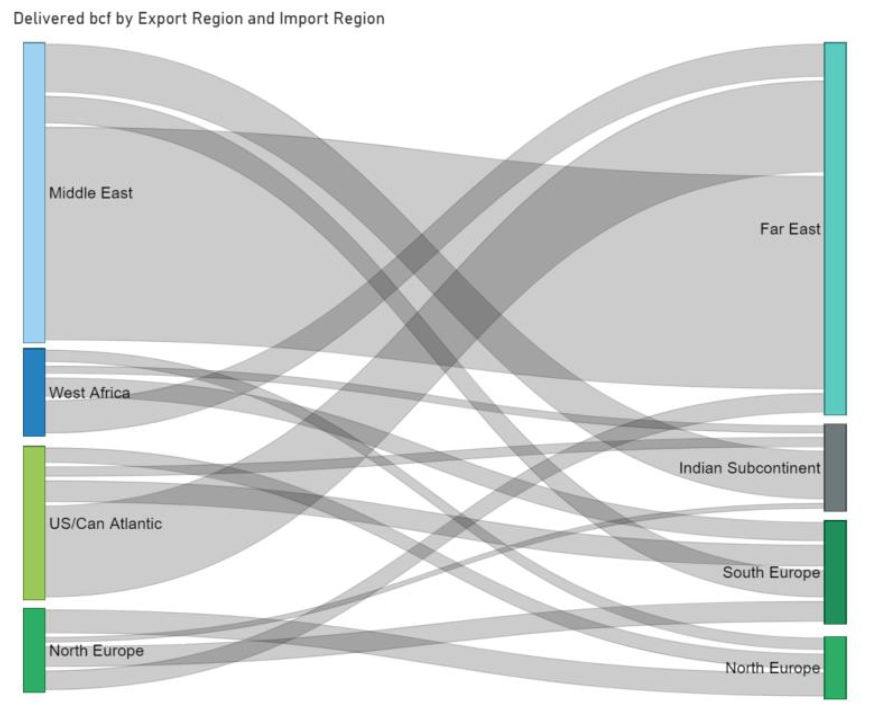
Pacific basin demand is generally supplied by LNG supply sources in order of proximity (subject to canal transit), as can be seen in Chart 1 which shows flows in Jan-21 (a tight month).
In a balanced market, the marginal source of supply that balances the Pacific basin determines the price spread between Asia (JKM) and Europe (TTF, or more specifically DES NW Europe). This price spread is based on the diversion cost to travel to either Europe or Asia.
The shipping diversion cost is generally influenced by prevailing time charter rates, DES prices (to value boil off cost) as well as differences in canal fees & port costs. This diversion cost logic can break down in certain market scenarios e.g. during the JKM price spikes this January.
When the market is very tight, JKM prices rise versus TTF to pull cargoes from further afield, i.e. from supply sources with longer voyages and a higher variable cost of delivery (e.g. North Atlantic). The most expensive tranche of incremental supply that can be diverted to Asia is typically the reload of European cargos.
In periods of oversupply that require the shut in of US supply to balance the LNG market (e.g. Summer 2020), Henry Hub can also play an important role. Henry Hub can act as a floor for both TTF and JKM with pricing dynamics driven by the variable costs of liquefaction and shipping.
These regime based pricing dynamics underpin the way we run stochastic simulations of prices in our LNG Bridge portfolio valuation model.
The current state of play
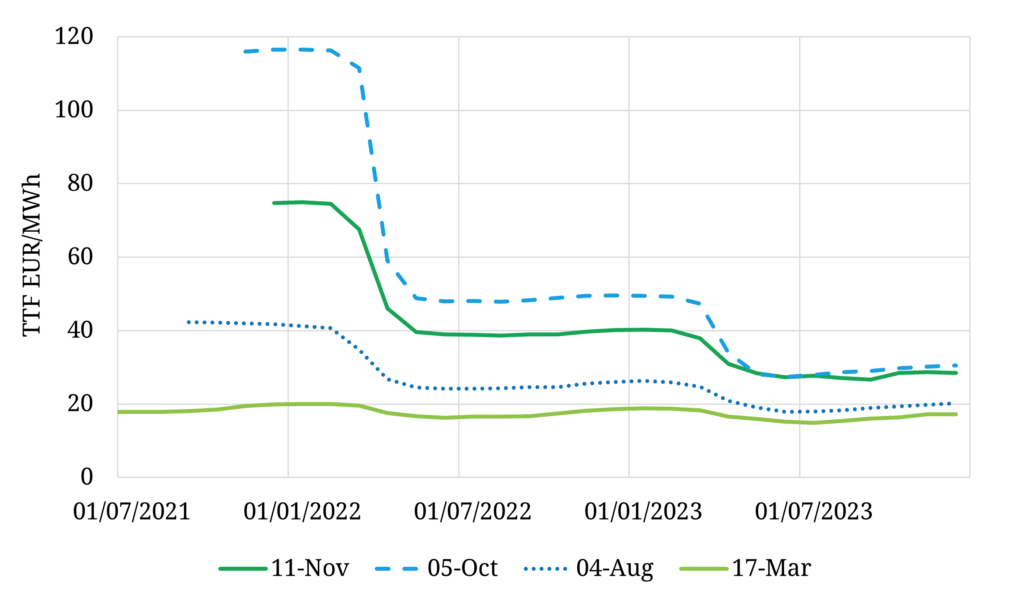
The relative levels of forward curves and diversion prices provide a useful view of prevailing JKM market dynamics. Chart 2 shows the forward curves for JKM & DES NW Europe (implied from TTF) – the blue lines.
The chart also shows diversion price levels for West African (WAF) & US supply – the dashed lines. If these diversion prices sit above the NW European price then it is more profitable to send cargoes to Asia. The diversion curves are calculated based on the JKM price less the incremental round trip costs to divert a cargo from Asia to Europe.
The first thing to note is that the JKM curve is more seasonal than TTF. This is due to lower storage capacity in Asia versus demand, which means that Asia needs to pull on the global LNG market more in the higher demand winter months, along with pricing in the cost of additional supply sources and canal transit risk.
The West Africa and US diversion cost curves are driven by JKM (less incremental diversion costs) and so have a similar shape to JKM. When these dashed curves sit above the NW European curve (as is currently the case across the coming winter), a higher value is achieved by diverting supply from Europe to Asia.
In other words strong Asian LNG demand is currently driving a premium of JKM over European prices, signalling the diversion of US & WAF supply from Europe. This is particularly the case across the coming winter, where the high risk premium reflects fears around potential time charter market tightness and Panama canal delays.
US cargos typically represent the key source of marginal supply in the LNG market (given large volumes and relative flexibility). Chart 2 shows how tightness across the current winter eases into 2022, with the US diversion curve reconverging with NW European prices. That is consistent with the forward market pricing in a more balanced market in 2022, relative to the acute tightness that has dominated 2021.
But for the moment both TTF and JKM prices continue to rise, with Winter 2021 forward prices hitting a new high last week.
We have developed an industry LNG price simulation engine in our LNG Bridge portfolio valuation & optimisation model. This enables traders, originators, risk managers & investment teams to understand the distribution of LNG price evolution, capturing interregional price marker relationships & market regime shifts. See here for more details.