European gas demand hit its ‘high-water’ level of 586 bcm in 2010. From 2010 to 2014 demand then reversed sharply, falling 19% (111 bcm), and commencing what many perceived to be an irreversible downward trend.
This trend was generally accepted to be in line with the growth of renewables in the power sector (at the expense of gas) and the slow demise of energy intensive industries in Europe as these were ‘offshored’ to developing Asia.
This script conveniently aligned with EU policy. It was consistent with reduced reliance on Russia as the largest source of natural gas imports. This was important given several points of disagreement between the EU and Russia. For example, territorial infringement in Ukraine, the issue of Nordstream 2 versus maintenance of transit flows (and revenues) through Ukraine, and squabbles over the use of downstream pipeline capacity related to Nordstream 1.
If reduced natural gas consumption was the EU policy ‘game plan’, the reality from 2016 onwards makes for uncomfortable reading. European gas demand has rebounded almost as quickly as it fell. And overwhelmingly, Russia has been the supplier benefitting from this.
What is driving demand growth
European gas demand has recovered 16% (77bcm) across 2014-17. This rebound has been surprisingly consistent across countries: UK 4.1%, Germany 6.0%, Italy 6.7%, France 5.5%, Netherlands 4.9%, Spain 4.8%, Turkey 3.2%, Belgium 4.3%, Others 5.5%.
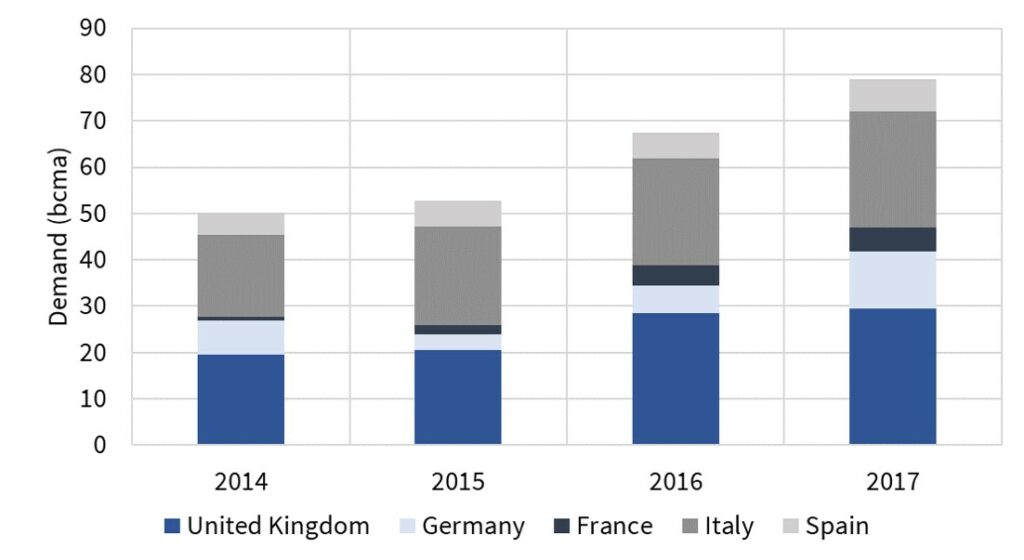
A recovery in economic & manufacturing growth has played an important role, particularly in 2016-17. Lower wholesale gas prices since 2014 (relative to earlier in the decade) have also helped support demand. But Chart 1 illustrates that one of the pillars of gas demand recovery has been power sector consumption.
Gas demand from power generators across these five markets accounts for ~30 bcma of the gas demand rebound since 2014. This is partly the result of gas for coal switching that has taken place given:
- Coal prices strengthening relative to gas prices
- A step up in the UK carbon price floor (to 18 £/t in Apr 2015)
However there are also some ‘one-off’ factors that have supported power sector demand e.g. the French nuclear outages in Winter 16/17 and low Spanish hydro availability in 2017.
The extent of power sector gas for coal switching over the next 3 years will be a key factor determining whether European gas demand continues to recover or stalls.
Where is new supply coming from?
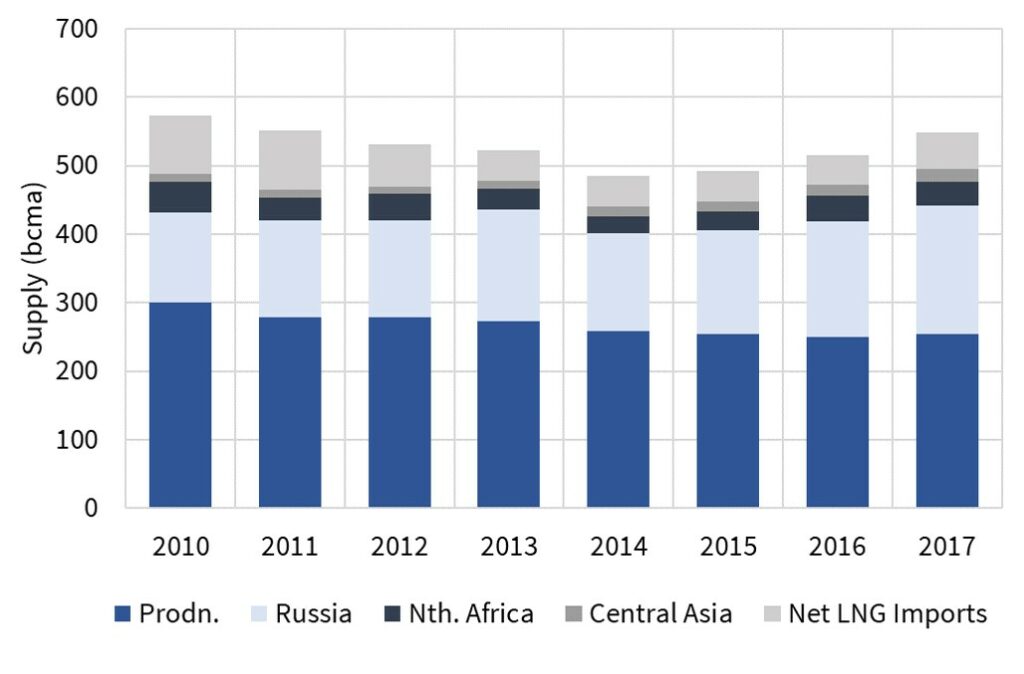
Chart 2 shows the dominance of Russia in meeting demand growth since 2014, with Russia providing 45bcm of the 77 bcm European growth.
Domestic European production has been in general decline since 2010, although this decline has stabilised somewhat over the last two years. This is partly due to strong Norwegian flows. But some UK production, which achieved FID during the high oil/gas price conditions of 2011–14, has also come onstream.
Non-Russian pipeline imports have been variable. It is thought that Algeria’s 2016 increase was achieved by ‘borrowing’ Hassi R’Mel recycle gas in advance of new fields coming onstream. Apart from the anticipated boost from Azerbaijan’s Shah Deniz 2 around the end of this decade – there is little prospect of an increase in non-Russian European pipeline gas imports.
LNG imports were around 90 bcma in 2010 and 2011, when new LNG supply projects hoping to target the US ended up in Europe by default (as a consequence of the US shale gas revolution). As Asian LNG demand has grown since then, it has drawn LNG away from Europe. 2017 saw a break in this trend. Growing global LNG supply caused European imports to increase by 20% over 2016 levels, though this was mainly confined to Southern Europe.
Higher LNG imports are the only substantial threat to Russia dominating incremental supply volumes into Europe. Surplus LNG cargoes flow into Europe as ‘price taking’ gas (i.e. insensitive to price while prices remain above US export shut in levels). But so far the volumes of surplus LNG imports into Europe have been well below demand growth, allowing Russia to step into the gap.
What next?
Some of the factors behind the rebound in European gas demand are unlikely to support further consistent demand growth. For example:
- UK has limited additional coal switch-out potential
- French nuclear capacity has returned to higher availability (at least for now)
- Drought/hydro issues revert to mean (which may be negative for gas demand)
But there are 5 structural drivers of the European gas market supply & demand balance we are keeping a close eye for guidance on what may happen next:
- Switching: Relative coal vs gas prices and associated power sector switching volumes
- Capacity mix: Pace of retirement of (i) coal, lignite & nuclear capacity & (ii) growth in renewables capacity
- Economic growth: Extent to which non-power sector gas demand continues to rise
- Domestic production: Pace of production decline (e.g. across Groningen, UKCS)
- LNG imports: Volume of surplus ‘price taking’ LNG flow into Europe
We will return to look at some of these drivers in more detail as the year progresses.