Europe’s role as the ‘global gas sink’ has been tested in Q2 2020. An acute temporary oversupply of gas and high storage inventories have seen front month prices at NBP and TTF plunge below 5 €/MWh (1.5 $/mmbtu).
“Storage maths has seen the European gas market growing increasingly nervous about negative hub prices… But the bigger risk may be asymmetrically the other way.”
Chart 1 illustrates the current state of play in the forward market with European hub prices trading below Henry Hub across the summer.
Chart 1: Key natural gas forward curves
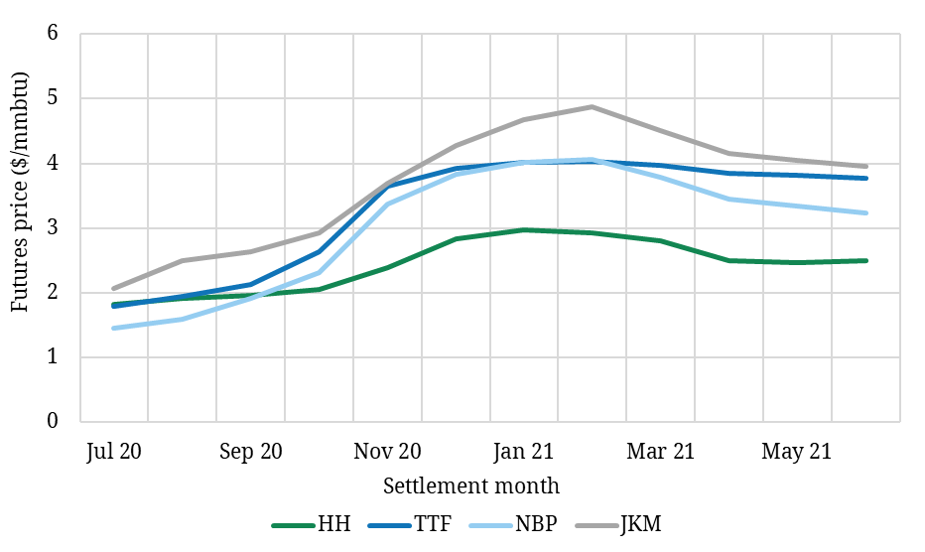
Source: CME, Timera Energy
Falling European hub price signals are doing their job and driving a major supply side response. Russian, Norwegian and North African pipelines are flowing at rates significantly lower than in recent years. And the absence of viable European netback price signals for US LNG has now seen the majority of US export volumes temporarily shut in.
In today’s article we look at the European supply side mechanisms that are responding to lower prices to clear the market.
Producer response
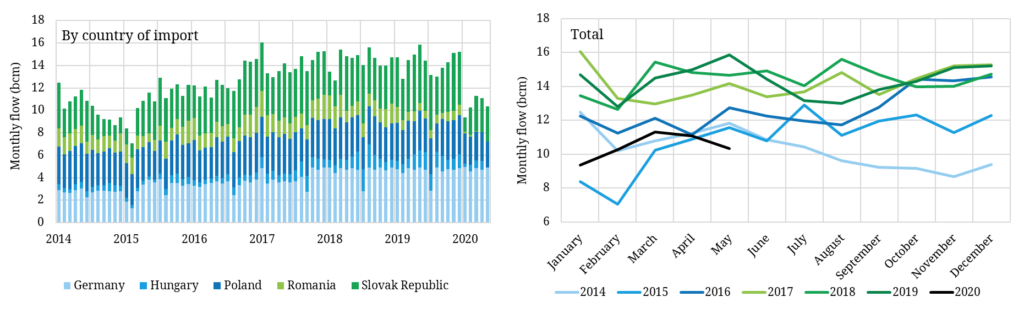
Russian flow volumes across Jan-May 2020 are down 28% year on year. The Nordstream flow route continues to flow at high volumes. But both the Eustream (Ukraine/Slovakia) and Yamal (Belarus/Poland) routes have seen substantial flow declines in 2020, as can be seen in the left hand panel of Chart 2.
Gazprom’s long term transit deal with Poland on the Yamal route expired in May. This increases Gazprom exposure to short term (daily) booking costs to flow gas. Low hub prices have not been covering the variable costs of Russian gas flows via the Yamal route, causing volumes to fall.
Gazprom’s announcements this year reflect a strategic reduction in exports to Europe given low prices. Gazprom has projected volumes to decline from 199.3 bcm in 2019 to 166.6 bcm in 2020 (though the latter includes exports to China – expected to be some 5 bcm in 2020). Adjusting for measurement norms and assuming typical re-exports to Ukraine and Kaliningrad of 14.3 bcm, Russian net exports to Europe for 2020 would amount to some 140 bcm vs 175bcm in 2019.
Russia sells gas to Europe under long-term contracts as well as via shorter term contracts on its Electronic Sales Platform (ESP) whose prices have closely shadowed those of TTF in recent months. This indicates a strategy of judicial volume placement rather than a ‘who blinks first’ volume maximisation strategy.
Russian export volumes to Europe are therefore running at low levels not seen since 2015 as shown in the right hand panel of Chart 2.
Norwegian flows to Europe are also down in 2020. Equinor have flagged that this is due to a combination of response to lower prices and maintenance (e.g. major outages in May). Norway has significant volume control from its large flexible fields (e.g. Troll) which it appears to be optimising in response to low prices.
The supply reduction trend extends to North African flows into Italy and Spain. Imports are down significantly year on year, with Algerian exports to Spain at record low levels.
Finally, and most importantly, US LNG export volumes have also fallen sharply across the last 3 months. Aggregate feedgas volumes into US export terminals were above 9 bcf per day in March (and rising as new trains ramped up). But feedgas volumes fell below 5 bcf per day last week as US shut ins increased in response to slumping European hub prices.
Most of the LNG volume contributing to downward pressure on hub prices over the last few weeks was already ‘locked into’ European delivery (given contractual and logistical constraints and response lead times).
Storage response
Unusually high European storage inventories have been an important factor behind plunging TTF prices across Q2. High volumes of gas in store reflect a mild winter, falling Q1 prices and preparations for the threat of a Ukraine transit deal disruption to Russian flows (that never eventuated).
Chart 3 shows how much higher aggregate 2020 European gas storage inventories are than the previous 5 years.
Chart 3: Aggregate European storage inventories
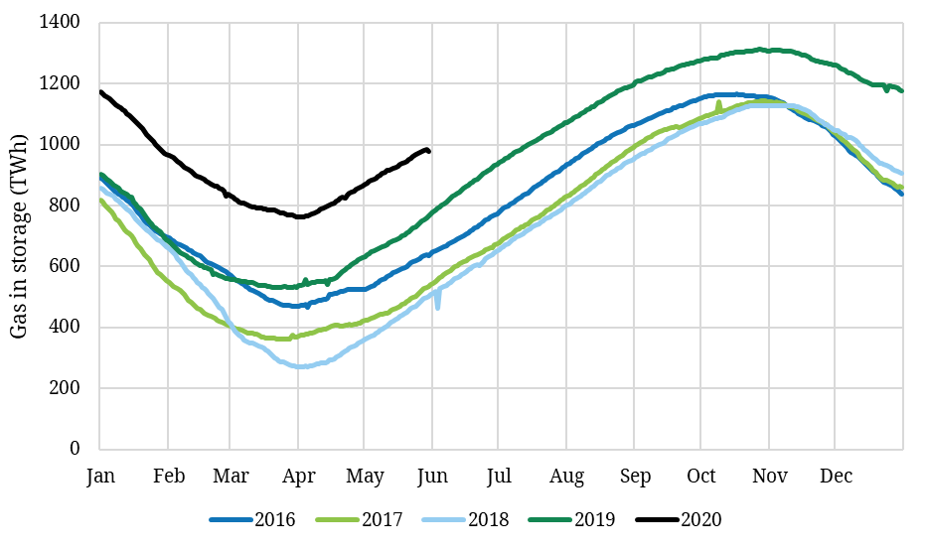
Source: AGSI, Timera Energy
With all the excitement around negative oil prices, some pundits have been predicting the same will happen with European hub prices, when storage inventories hit limits. But as well as the supply side response we set out above, there is an important factor in play that is likely to prevent negative hub prices.
Ukraine has a large volume (30 bcm) of underutilised gas storage capacity. Inventory levels were running at just over half of that volume (as of May). That leaves a large additional potential ‘sink’ for discounted hub gas, with a strong incentive to store given a huge forward curve contango into the coming winter (e.g. a 200%+ return on the Jul-20 to Jan-21 TTF price spread).
There is however some uncertainty as to how much of this additional storage will actually be utilised in practice. Ukrainian companies are likely to import a further 2 bcm to inject into storage for seasonal balancing. European shippers & traders could then flow another 5 or even possibly 10 bcm to Ukraine for injection across the summer.
That represents a significant incremental demand for gas across this summer that means that even if other European storage hits tank tops, Ukraine is unlikely to follow suit.
At the start of June 2020, storage inventory in Europe was 73bcm, just 27 bcm below full European capacity. Adding in 10 bcm from Ukraine there is just 37 bcm of storage space with more than 4 months of the injection season to run. From June to October 2019 the monthly fill rate was 8 bcm per month, so 2020 may still go close to testing the upper limits of storage capacity.
Watch for the bounce
The storage maths above has seen the European gas market growing increasingly nervous about negative hub prices. Bearish sentiment has not only seen prices this summer fall, but a 20-30% decline of the forward curve since the start of 2020.
With a growing focus on the downside, the bigger risk may be asymmetrically the other way. The details we set out in today’s article, show a well functioning supply side response to lower prices. And beyond the acute temporary oversupply of this summer, there are structural forces working to rebalance both the European and global gas markets.
European gas demand is starting to recover sharply (after a large downward shock) as lock down measures are lifted. Even if demand falls well short of pre-Covid levels, the next 2 to 3 months are likely to see demand recovery continue towards more normal summer levels, as countries return to work.
Global LNG demand has also been more robust than market consensus in 2020, with strong evidence of Asian demand side response. Meanwhile large LNG producers such as oil majors are slashing capex and upstream investment budgets.
European gas prices may surprise to the upside across the next 2 to 3 years as the LNG market moves out of acute over supply into a more normal state of balance. Gas prices are the dominant driver of wholesale power prices across Europe. So a sharp recovery in gas prices would feed through directly into higher power prices.
When everyone is looking down, it can pay to pull your head up. Beware getting caught structurally short European gas or power. From an investment perspective, market price signals may recover much more quickly than consensus expectations.