European gas demand fell 20% across the first half of this decade. Declining CCGT load factors in the power sector were the main driver of this decline, as coal & carbon prices fell and renewable output increased.
The fall in gas demand contributed to the emergence of a significant surplus of European gas supply flexibility. Flex oversupply was compounded by new storage and pipeline infrastructure coming online, based on investment decisions made in tighter conditions towards the end of last decade. These factors combined to drive down market price signals for flexibility, with substantial declines in summer/winter price spreads and spot gas price volatility.
But European gas demand hit an inflection point in 2014. Demand across Europe recovered 52 bcma (11%) between 2014 and 2016. That recovery is continuing into 2017, with evidence of ongoing power sector switching of gas for coal plant, as well as the impact of a broader recovery in economic growth.
We take a look today at the key markets driving demand recovery.
Shining a light on the recovery drivers
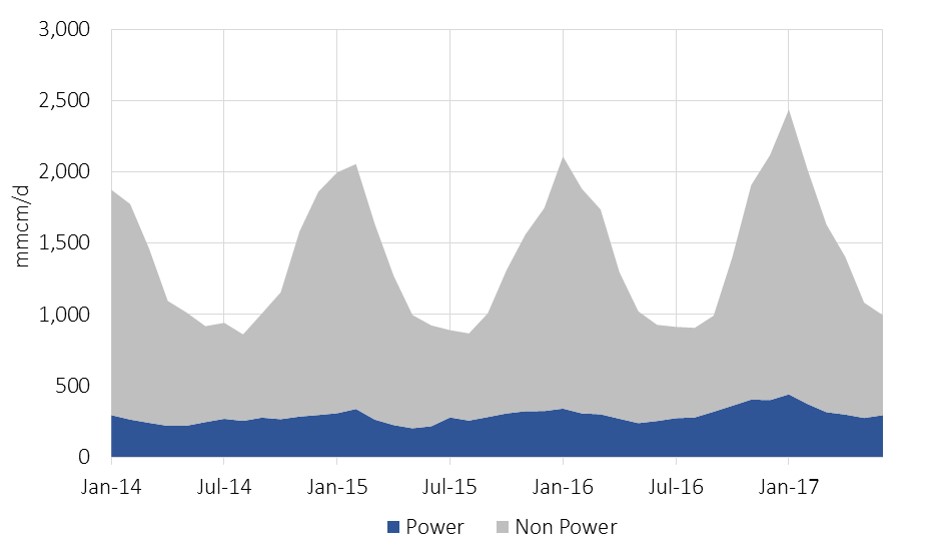
Chart 1 shows the evolution of European gas demand across the ‘EU 29’ countries (including Norway, Switzerland & Turkey). 2014 marked the trough of this decade’s decline in gas demand. This was helped by weaker demand in 2014 given a relatively mild year of weather. The demand recovery since 2014 can be seen in Chart 1, with the power sector playing an important role, particularly across the last 12 months.
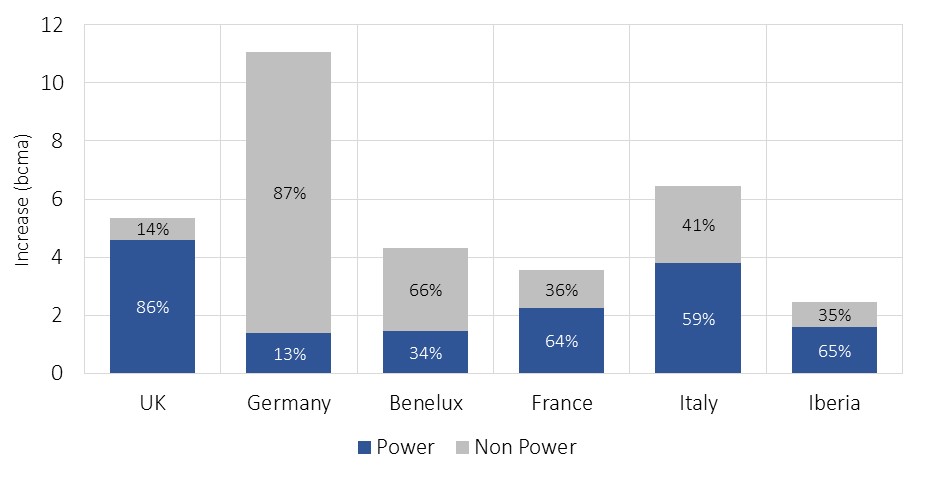
In order to better understand the drivers of demand recovery it is useful to focus in on Europe’s key gas markets, shown in Chart 2.
Chart 2 shows the key role of the power sector in driving demand recovery. The power sector accounts for just over 20% of total European gas demand. But it has accounted for a much higher percentage of the demand recovery since 2014, particularly in the key Western European gas markets shown in Chart 2.
The power sector switching impact in boosting gas demand has been greatest in the UK and Italy, accounting for 86% and 59% of respective gas demand growth across this period. Switching is most pronounced in the UK given the carbon price floor (18 £/t premium).
The power sector has also played an important role in demand recovery in France, Iberia (Spain + Portugal) and the Benelux region. Increases in power sector demand have been particularly pronounced over the last 12-18 months. The rise in coal prices relative to gas prices across this period has supported switching across all markets. But there have also been specific issues in play e.g. the French nuclear outages of last winter and recent low hydro balances on the Iberian peninsula.
An 11bcm increase in German gas demand (H1 2014-17) has been a major factor behind the overall recovery in European demand. Chart 1 is misleading here in suggesting that the power sector has not been doing the heavy lifting in Germany (a function of the data series). When gas burn for both generation and heat is accounted for, the grid connected power sector accounts for around 5 bcm of the 11bcm increase. This is even higher if distribution connected gas assets are included (although data here is more difficult). The commercial & residential sector account for most of the remaining increase (which is partly weather related with cooler temperatures in H1 17 vs 14).
A more positive economic backdrop is a factor that is helping with a broader demand uplift across most European gas markets.
Further demand recovery
Market consensus for European gas demand at the start of this decade was for slow but steady growth. Expectations had turned decidedly bearish by 2014-15, ranging from broadly flat to a steady decline. A power sector driven recovery in demand of more than 10% across the last two years has surprised almost everyone.
Two key factors are likely to determine what happens with gas demand going forward:
- Further switching: UK power sector switching has largely happened, but there is significant potential for further Continental European switching (e.g. across Germany, Benelux and Iberia), depending on the relative path of coal vs gas prices.
- Economic growth: Whatever your views on the longer term risks of the European Central Bank’s €60 billion a month of QE bond purchase programme, it has coincided with a recovery in European growth since 2015. Further growth is likely to be important in underpinning a continuing recovery in gas demand.
The recovery in European gas demand since 2015 has been an important factor allowing the orderly absorption of higher import volumes of Russian gas and LNG. Gazprom appears to be shifting towards defending a higher market share target than it has historically (closer to 170 bcma vs 150 bcma pre 2015).
There have also been early signs of a recovery in price signals for gas supply flexibility in the UK, with a significant pickup in NBP spot price volatility over the last 18 months. This is yet to be mirrored at the Dutch TTF. But a recovery in gas demand across Europe is an important factor in eroding the overhang of gas supply flexibility that has prevailed since the start of this decade.