LNG imports account for about 10% of European gas supply (~60 bcm in 2017). Remaining supply is split fairly evenly between domestic production (dominated by Norway, UK and the Netherlands) and pipeline imports (dominated by Russia).
LNG imports may seem a relatively small portion of the supply mix. But they have a disproportionate influence in setting hub prices. This is because of the flexible, price responsive nature of LNG supply into Europe.
These characteristics also mean that European LNG import volumes ebb and flow based on market prices. The benchmark price signal driving LNG flows is the spread between TTF and Asian LNG spot prices. In today’s article we look at the recent evolution of this spread and its impact on European hubs.
Europe vs Asian price spread
The grey line in Chart 1 shows the evolution of the spread between a Singapore LNG spot price marker and the front month Dutch TTF hub price (against the right hand axis). If you prefer to think of spot prices in North Asian terms then you can add 0.5 $/mmbtu to the Singapore price as a rule of thumb.
The bars in Chart 1 show European LNG reload volumes (against the left hand axis). Reloads have a clear relationship to the price spread, particularly in 2017 & 2018, with volumes typically rising significantly with spreads above 1.50 $/mmbtu. But there are other logistical and contractual factors that can incentivise reloads at lower spreads. For example, in 2016 a number of cargoes reloaded from France related to contractual incentives to on sell volumes to Japan (despite a relatively low prevailing spot price spread).
Chart 1: Asia vs TTF front month price spread & European LNG reload volumes
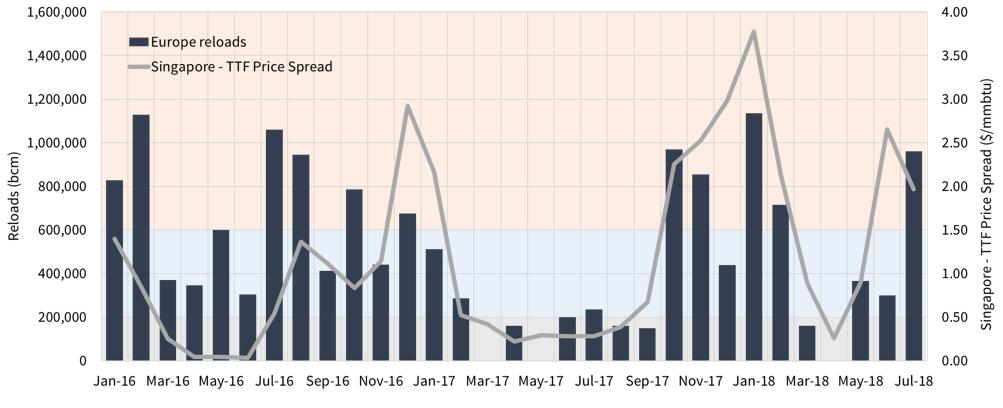
Source: Timera Energy, ICIS, SGX, Spectron
There has been a pronounced seasonal profile to the Europe vs Asian price spread over the last three years. This has reflected stronger Asian demand for LNG in winter given relatively low volumes of domestic storage (particularly in China). To attract additional winter volumes, Asian LNG spot prices rise above European hub prices, creating an incentive to re-route or reload European LNG cargoes to Asia.
Until this year, Asian spot prices had tended to re-converge with TTF over the summer months. But 2018 has seen a sharp move higher in summer price spreads given unseasonably strong Asian demand.
LNG demand in Asia was up 12% (y-o-y) in H1 2018. Demand growth was driven by China (+5 mtpa), India (+3 mtpa) and Sth Korea (+3mtpa). This demand growth trend has extended over what has been an unusually hot summer.
In addition to strong Chinese & Indian demand across summer, Japanese LNG demand (subdued in H1) has surged across July & August as heatwaves have seen air-conditioning driven demand depleting gas inventories.
So what does all this mean for European hub prices?
LNG swing one of 3 marginal hub price drivers
European hub prices are currently being set by the interaction between 3 key drivers at the margin:
- Power sector switching: As coal and carbon prices have risen in 2018, they are lifting gas for coal plant switching levels. This is increasing gas burn in the power sector and pulling up hub prices.
- LNG supply flexibility: Asian vs TTF price spread dynamics (described above) are driving the volume of LNG flowing into European hubs. Higher Asian/TTF spreads across 2018 have seen LNG supply diverted away from Europe, also helping to lift hub prices.
- Russian flows: The supply gap resulting from switching (1.) and LNG diversions (2.) is largely being met by Russian imports. This is via a combination of oil-indexed swing contract volumes (increasingly being managed via the TTF price window mechanism that Gazprom has conceded in a number of major supply contracts) and Gazprom’s sale of additional uncontracted volumes at European hubs.
We have explored the pricing dynamics of 1. and 3. in previous articles. Today we focus on 2.
3 price states driving LNG supply flexibility
The behaviour of LNG supply flexibility can be related to Asian/TTF spread ranges in Chart 1. There are broadly three states of this price spread as described in Table 1 below.
Table 1: 3 states driving LNG supply flexibility
It should be noted that the spread ranges in Table 1 are approximate only. Flow drivers for individual cargoes can be much more complex, depending on factors such as internal portfolio costs, contractual incentives and charter rates.
Spread behaviour and arbitrage dynamics
The structural Asia vs European price divergence that characterised 2011-13 is gone. Arbitrage response from rapidly growing volumes of flexible LNG supply and liquidity ensures that spread divergence is now only a temporary phenomenon.
Think of the Asia vs TTF price spread as a rubber band attached to a heavy but movable object. The spread can temporarily stretch to respond to higher Asian demand. But there are strong market forces acting to alleviate spread divergence (or release tension from the band). Diversion of flexible LNG from Europe puts upward pressure on TTF and downward pressure on the Asian spot price.
Fluctuations in the Asia/TTF spread are set to remain, particularly if Asian demand strength continues. Spread volatility reflects inherent constraints or inertia in the LNG supply chain to respond to market price signals.
The influence of these LNG price moves on European hub prices is set to grow over the next 3 years. This is a natural consequence of a steep rise in flexible LNG supply volumes (particularly from US exports). This makes the Asia/TTF price spread an increasingly important barometer to watch in Europe.