Let’s take a trip back 18 months in time. It is September 2018. TTF prices are testing 30 €/MWh (10 $/mmbtu). JKM, the key Asian spot LNG price marker, is at a 2 $/mmbtu premium to TTF as strong Asian demand growth pulls LNG cargoes away from Europe. This is a tight global gas market and consensus is that it will continue. The ‘LNG supply glut’ narrative has officially died and gone to heaven.
“Peaks & troughs are easy to spot with the benefit of hindsight. But picking market turning points in the eye of the storm is another matter entirely.”
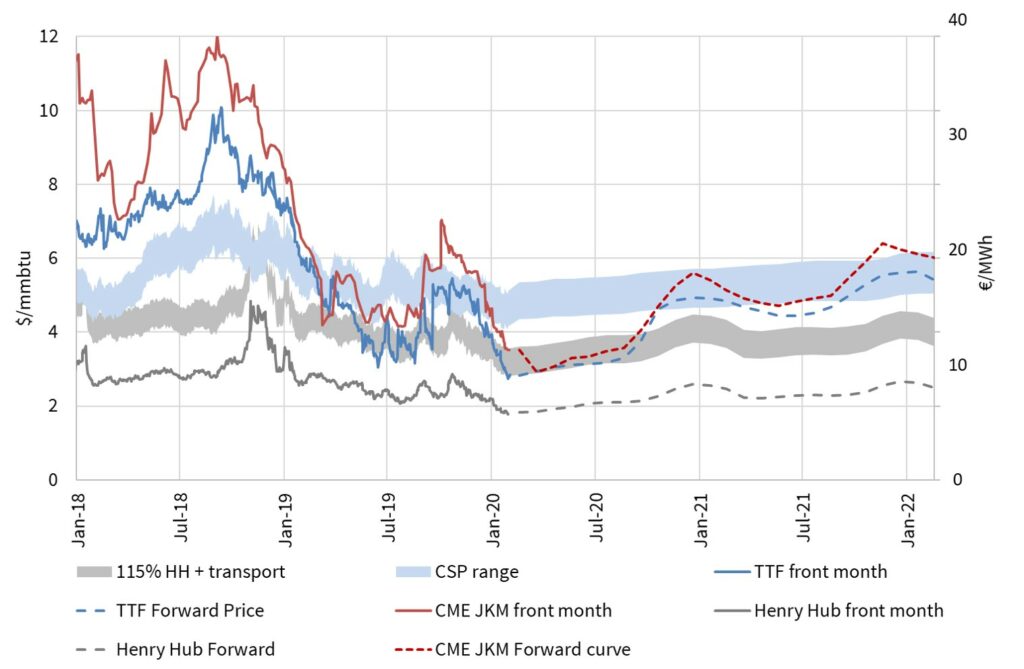
Now let’s return to the reality of Feb 2020. Despite being mid-winter, TTF prices are one-third of what they were in Summer 2018. TTF has recently hit 9 €/MWh (~ 2.70 $/mmbtu). JKM prices have converged to TTF as surplus LNG floods into Europe. The weight of additional supply has pushed TTF down to within 1 $/mmbtu of US Henry Hub (which is also falling due to weak US market fundamentals). Chart 1 helps bring this dramatic 18 month market transition to life.
Market peaks & troughs are famously easy to spot with the benefit of hindsight. But picking market turning points in the eye of the storm is another matter entirely. In today’s article we explore what is driving European gas prices and how low they could go.
Pushing through the switching range
As became apparent post Sep-2018, the global gas market is currently very well supplied. As a result, Europe with its liquid gas markets and available regasification capacity has seen an influx of LNG cargoes looking for a home.
In 2019, Europe saw a record 116 bcm of regasified gas leaving its terminals, a 48 bcm step up relative to 2018. Some of this LNG was required to meet ‘demand as normal’ given the rapid decline in output from the giant Dutch Groningen field. But beyond this, it has been the price responsive European power sector, in the form of switching of gas for coal plants, that has played the dominant role in absorbing surplus global LNG.
As a result, across 2019 European gas prices were closely linked to European power markets, more specifically coal and carbon prices. In other words, gas prices fell to a level that moved CCGTs ahead of coal plants in the merit order.
There is no single switching price level, but rather a price range as shown by the shaded blue band in Chart 1. The top end of this range shows the gas price required to switch the least efficient coal plants with most efficient CCGTs. The lower end shows the price required to switch the most efficient coal plants with least efficient CCGTs.
Despite robust carbon prices in 2019, falling coal prices acted to pull down the switching range as the year progressed.
Henry Hub now driving global prices
From Q2-2019, a new price dynamic set in. As surplus LNG kept flowing into Europe, storage inventories were reaching capacity and the potential to replace coal in the power sector was largely exhausted.
TTF spot prices dropped to a new support level at which prices incentivise ‘shut in’ of US exports. This Henry Hub shut in range is shown as the grey shaded band in Chart 1 and is calculated based on the variable (or avoidable) cost of bringing US LNG to Europe.
The logic here is if European gas prices fall below the US shut in level, it does not make economic sense to bring cargoes to Europe, causing US liquefaction volumes to decline and providing support to the LNG market.
The dynamics around shut in of US LNG are complex. Avoidable costs for bringing cargoes to Europe vary by US terminal location, LNG portfolio (e.g. sunk cost structure) and time horizon. Typically within a 6 week window LNG flows are quite price insensitive given physical logistical constraints e.g. associated with scheduling of vessels.
The grey range in Chart 1 is based on a 0.75-1.50 $/mmbtu avoidable cost range above Henry Hub prices. This reflects the variable costs of liquefaction, shipping and regasification. The lower end of this range reflects the fact that shipping and regas costs for many LNG portfolios are ‘sunk’ and variable transport costs also be reduced by running vessels on boil off gas.
Chart 2 shows the relationship between the evolution of the TTF and Henry Hub forward curves. The most recent curves from Feb-2020 (the lowest of the blue and green lines), show how TTF has converged to a level of around 1 $/mmbtu above Henry Hub, consistent with the lower end of our shut in range estimates.
Chart 2: Evolution of TTF vs Henry Hub forward curves (Oct-19 to Feb-20)
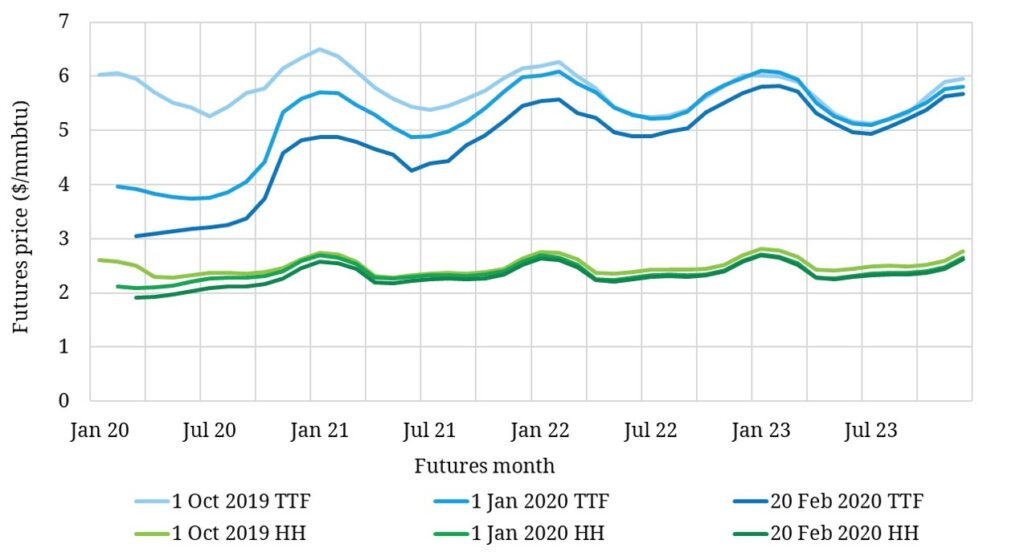
Source: Timera Energy, CME
The TTF forward curve is sitting at the bottom of the US shut in range across Summer-2020. This points to the imminent shut in of some US export volumes. Anecdotal evidence of this emerged last week with reports suggesting Naturgy had cancelled an April loading cargo at Sabine Pass.
TTF prices at current levels mean that European exports have become a tough prospect for many US LNG exporters. However, Europe still remains an attractive market for LNG from other low cost sources such as Qatar.
Current price dynamics mean that European gas markets now move to the tune of the US gas market as reflected in the Henry Hub price marker. The overall implication is that we are truly moving away from regional gas markets to one global gas market. In order to understand one region, you need to understand the global picture and to understand the global picture, you need to take a view not only of regional gas dynamics but also power market developments and switching dynamics.
How low can prices go this summer?
The future is best considered in two time horizons: 1. market dynamics across Summer-2020 and 2. what then happens beyond.
As we approach this summer, there is a relatively acute oversupply of gas, both globally and within the US gas market. The global oversupply is pushing JKM and TTF down towards Henry Hub. Henry Hub is in turn falling given a warm winter, high domestic production levels and high storage inventories.
Overlaid against this supply backdrop is the near term demand impact of the coronavirus. Early indications are that Chinese industrial and economic activity will slump in February. This is consistent with Chinese LNG buyers attempting to invoke force majeure clauses on LNG contracts to divert unwanted cargoes.
In a downside scenario where the economic impact of the virus on China continues into the summer, and potentially spreads to neighbouring countries, Asian LNG demand could temporarily take a further hit. The question of how low European prices can go in this scenario, largely comes down to Henry Hub.
US shut ins can cause a large reduction in global LNG supply in a relatively small price range. US export capacity is now nearing 60 mtpa (82 bcma). If the TTF forward curve continues to converge towards Henry Hub, large scale cargo cancellation is likely to occur e.g. at Sabine Pass where export contracts are Henry Hub linked.
US shut ins do not preclude a temporary slump in spot prices e.g. within the 6 week LNG logistics window we refer to above. But it is very difficult to create a scenario where TTF prices fall structurally below the US shut in range for a prolonged period.
The path to price recovery
Beyond the specific dynamics of the current summer, TTF forward prices point to a return to switching as the dominant price driver. Chart 1 shows Winter 2020 prices rising back up into the blue switching range, where they remain across most of the rest of the forward curve horizon.
But could we back in the same situation again in Summer 2021? It is not impossible, but it would likely require a major shock to LNG demand (e.g. a major global recession).
The reason for this is a major shift in LNG market balance in 2021. Around 65 bcm of new LNG supply is due online in 2020. But new supply volumes are set to fall to around 13 bcm in 2021 and only 6bcm in 2022, well short of anticipated global demand growth. So in the absence of a demand shock, this rapid drop off in new supply will structurally tighten the LNG market balance and alleviate pressure on European hubs.
The current downturn in TTF prices was triggered by a shift in LNG market balance back in Q4 2018. The price recovery turning point is likely to have a strong LNG market link as well. The dynamics playing out in Summer 2020 could well mark the bottom of the current gas price cycle.