Underground gas storage plays a key role in balancing the European gas market.
“Gas price volatility started to wake up in 2017… seasonal spreads came back to life in 2019-20.”
There are three drivers underpinning the importance of storage flexibility:
- Europe’s increasing dependency on complex import supply chains (e.g. LNG, Russia), as domestic production rapidly declines
- Rapid renewables growth driving a requirement for more flexible operation of gas-fired power plants to balance power markets
- Ageing midstream gas infrastructure coupled with very low levels of capex investment.
Despite these drivers, many midstream gas investors are making for the exits as decarbonisation gathers pace.
The momentum towards a substantially reduced European gas footprint by 2050 is clear. But investors are struggling to price the impact of this on midstream gas asset value. While decarbonisation spells terminal value decline for some midstream gas assets, the path to decarbonisation will depend on the flexibility provided by other midstream assets.
In today’s article we look at the evolution of market price signals driving storage value. We also look at storage margin capture across the last 5 years as an indication of key market drivers in play.
Market price signals have come back to life
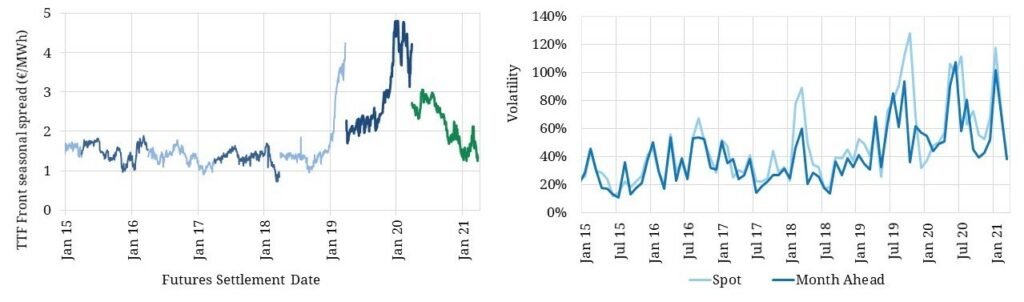
Storage value is driven by two key price signals. Summer/winter price spreads drive the value of seasonal flexibility. Spot price volatility drives the value of shorter term deliverability of gas. The evolution of these two price signals over the last 5 years is shown in Chart 1.
For a good part of last decade, both of these price signals went to sleep, lulled by an oversupply of midstream supply flexibility and weaker than expected gas demand.
Gas price volatility started to wake up in 2017 and has seen a structural trend higher since. Volatility has been supported by the ebbs and flows of LNG imports into Europe and a relatively rapid transition from a tighter market in 2018, to oversupplied 2019-20 and back to tight again in 2021.
Seasonal price spreads came to life in 2019, with significant moves across the last 2 years. LNG has played a major role in driving spreads as well as volatility. The big rise in seasonal spreads in 2019 and then 2020 was primarily the result of surplus LNG volumes pushing down summer forward prices (relative to winter). This saw TTF seasonal spreads move up towards 5 €/MWh in the lead up to the 2020 gas storage year (Apr 2020) as can be seen by the dark blue line in the left hand panel of Chart 1.
The decline in TTF spreads across the last 12 months has been driven by a significant recovery in 2022 summer gas prices as the LNG market gas tightened and supply has been diverted from Europe.
The re-emergence of activity in storage price signals has coincided with a renewed buyer interest in European gas storage capacity across the last three years.
What is going on with storage margins?
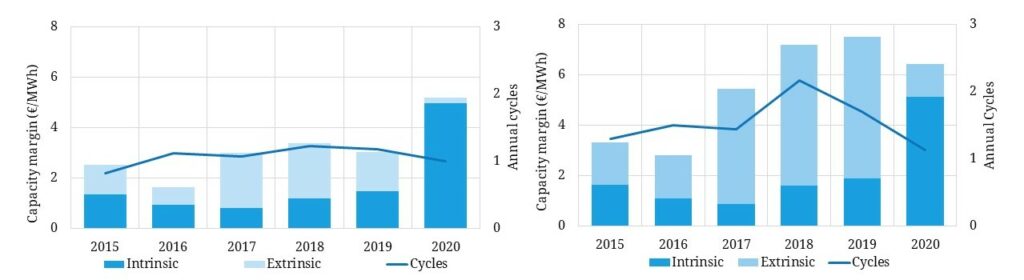
Gas storage years run from April to March to broadly align to the start of the summer injection season. In Chart 2 we show a backtest analysis of storage capacity margins across the 2020 gas storage year that has recently ended (Apr 2020 – Mar 2021), compared to the previous 5 years.
The left hand panel shows backtested margins for a generic seasonal asset (2 cycle capability per year), the right hand panel a fast cycle asset (6 cycle capability per year).
We have undertaken the analysis using Timera’s gas storage optimisation model which is well known in the industry and has been used to support multiple gas storage asset investments and transactions. In order to do the analysis we have applied some key assumptions.
Our backtest analysis assumes a rolling intrinsic trading strategy is applied with assets having access to the TTF hub. The trading strategy of the storage capacity holder is a key driver of risk & return.
A challenge with backtesting storage capacity is the treatment of legacy inventory positions. In reality, different capacity holders will have different inventory positions that impact margin capture. For consistency & simplicity across years, we assume that storage capacity is empty on ‘day 1’ of the storage year.
There is a defining feature of 2020 storage margin versus previous years: high seasonal spreads in Q1 2020 enabled high intrinsic margin to be locked in at the start of the storage year (~5 €/MWh of intrinsic margin including monthly profiling). That results in intrinsic margin surging for both storage types relative to previous years.
There is one important caveat that impacts the ability of capacity holders to capture this margin in practice. Our backtest analysis is based on zero inventory at the start of each storage year, but most storage facilities had unusually high inventories in Q1 2020, due to the impact of a combination of weather impacts and the sudden onset of the Covid shock.
Existing inventory levels limit the extent to which individual storage assets can capture available price spreads. Inventory reduces the intrinsic value that can be captured via hedging seasonal spreads. In other words it reduces the height of the intrinsic margin bar in Chart 2. This doesn’t however undermine overall analysis of extrinsic value and margin capture dynamics.
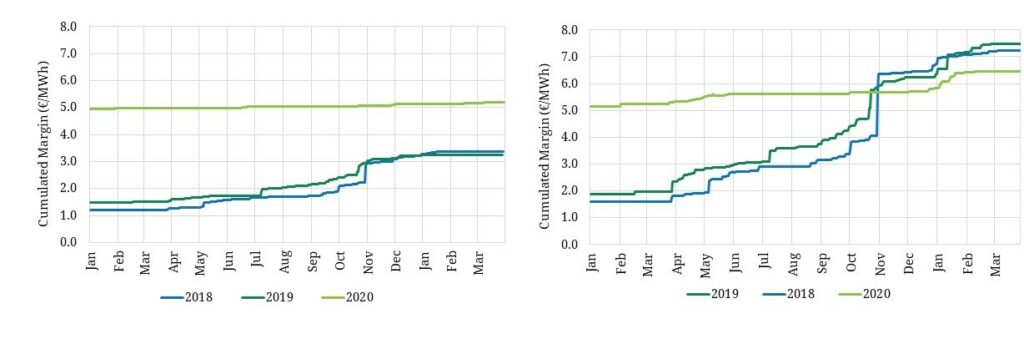
The impact of a very strong seasonal price spread signal in 2020 is shown in Chart 3, which compares the cumulative build up of rolling intrinsic margin capture in 2020 versus the previous two years.
Across the 2017 – 2019 years, only 1 to 2 €/MWh of intrinsic margin could be hedged against forward spreads in April each year, compared to 5 €/MWh in 2020.
Locking in such a high intrinsic margin acted to reduce the level of extrinsic margin capture as 2020 progressed. A very high summer/winter price spread incentivises capacity holders to profile gas seasonally, not to use storage flexibility to respond to market volatility.
Put another way, with such a high initial spread hedge level, there are limited opportunities for re-optimisation of the initial forward hedge position to capture incremental extrinsic value, for both seasonal and fast cycle storage.
These dynamics caused an unusual convergence in the backtested margins of seasonal & fast cycle storage assets. However going forward volatility is set to return as the predominant driver of fast cycle storage margin capture. And the 3 drivers we set out at the start of our article point to a structural trend higher in TTF spot price volatility.