There has been a huge expansion in renewable power portfolios across Europe over the last 5 years. This has been supported by rapidly declining costs, good access to capital and an improving policy environment. Growth is set to continue across the 2020s, but with a very new set of challenges.
“And size does matter. Optimal sizing of flex vs RES volumes evolves over time with changes in market pricing dynamics and the underlying renewables portfolio.”
Renewable investors have historically been insulated from wholesale power price exposure. But this is changing as existing policy support measures (e.g. FiTs and ROCs) start to roll off and merchant exposure is becoming more common (either as a way to increase returns or due to the paring back of policy support for more mature technologies).
The impacts of Covid-19 in pulling forward higher renewable penetration have sharpened investor focus on market price risks going forward. These risks include falling wholesale prices, increasing price cannibalisation and higher balancing cost exposure.
Flexible ‘peaking’ asset returns such as batteries and gas engines have stood up relatively well to the Covid crisis. Flex assets also benefit from characteristics that diversify and offset renewable portfolio exposures. This is driving a surge in investor interest in adding storage and engines to wind and solar portfolios.
In today’s article, the first in a series, we set out how the price exposures of renewables and flex assets can complement each other to manage portfolio risk and improve returns.
The renewables risk challenge
There is a wide range of Renewable Energy Sources (RES) across European power markets. But for the purposes of this article we focus on wind and solar, as the key sources of incremental RES power asset volumes.
The wholesale market price risk of wind & solar assets can be grouped into 3 sources:
- Commodity price: exposure to movements in power prices, driven primarily by underlying gas & carbon price movements (e.g. falling gas prices across 2019-20)
- Cannibalisation: as system renewables volumes grow, correlated wind & solar output profiles increasingly erode asset capture prices (vs baseload or time weighted average prices)
- Balancing: Balancing price exposure which increases over time as renewable volumes grow and balancing (or cashout) prices become more volatile.
These sources of market price risk have historically been mitigated by policy support mechanisms. The extent of risk mitigation depends on whether support is paid as a premium on top of wholesale prices (e.g. UK ROCs and premium FiTs in Continental markets) or at a fixed price level (e.g. UK FiT/CfDs).
Corporate PPAs are another market risk mitigation route for RES asset owners, allowing transfer or sharing of risk with a corporate counterparty. PPAs are becoming more common in Europe, although aggregate volumes are still relatively small.
RES assets receiving a premium on top of wholesale prices are significantly more exposed to commodity price risk and cannibalisation than assets receiving fixed price support (e.g. under CfDs or PPAs).
Regardless of the support mechanism in place, the market exposure of RES assets is increasing over time due to:
- The approaching roll-off of existing support mechanisms (e.g. German FiTs from 2021, UK ROCs from 2022)
- Tranches of merchant exposure being introduced into RES projects to support investment cases and increase returns (e.g. increasing market exposure in UK offshore wind projects)
- The rise of pure merchant renewables projects e.g. onshore wind in the UK and Germany and solar PV in Spain and Italy.
These factors are set to increase the market price exposure of RES portfolios as the 2020s progresses. Recognising this structural trend, RES investors are looking to define portfolio risk mitigation strategies in response.
Why flex assets complement renewables
RES portfolios can be relied on to deliver relatively stable average energy volumes, regardless of market conditions. However the ‘must run’ nature of RES assets means that portfolio owners are price takers, exposed to prevailing market prices during periods of output (and therefore price declines and cannibalisation).
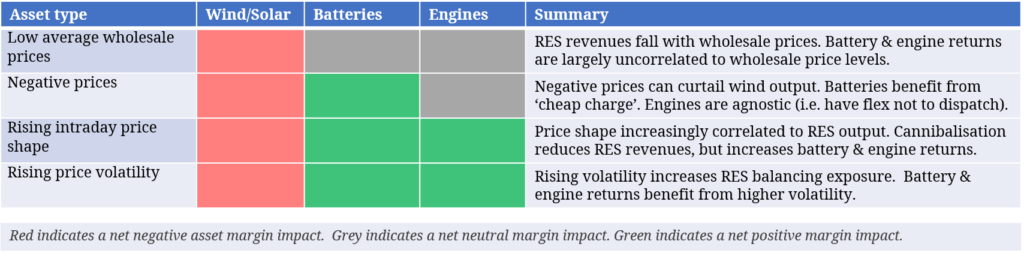
Flex assets on the other hand can be tactically dispatched into market periods with advantageous prices and benefit from increased power price volatility. However flex assets carry significant volume risk e.g. lower output & returns in periods of high RES output.
The addition of flexible assets, such as storage or engines, to a renewable portfolio can provide substantial risk diversification benefits. The complementary nature of flex asset classes is driven by uncorrelated or negatively correlated returns relative to wind and solar assets as summarised in Diagram 1.