European gas prices have declined steadily from 2018 to 2020 as we showed in animation last week. The European gas market has just faced the most acute period of oversupply in its history across the first half of 2020. Yet despite low prices & oversupply, gas storage margins have continued to march higher across the last three years.
Gas storage developers in Europe are as extinct as the dodo… this is slowly but surely eroding the supply of gas flexibility.
Recent market conditions are not a classic environment for rising gas storage value. Strong returns for flexible midstream assets are more commonly aligned to periods of market tightness and higher gas prices. So in today’s article we explore what is going on.
We wrote several articles in 2016 & 2017 about the start of a structural recovery in gas storage margins. This recovery has gained momentum across the last three years and the three structural drivers we set out remain the dominant forces:
- Import dependency: as domestic production in Europe declines, the gas market is becoming more dependent on longer & less flexible supply chains e.g. LNG & Russian pipeline gas
- Power sector transition: gas fired power plants are playing a greater flex provision role as Europe closes coal & nuclear plants and rapidly grows intermittent renewable capacity
- Ageing infrastructure: there have been very low levels of investment in gas storage infrastructure since the middle of last decade (both maintenance & renewal capex) as well as retirement of some older storage capacity, eroding the supply of flexibility.
In order to better understand the evolution of storage value capture, we look at market price signal dynamics and show a ‘backtest’ of storage margins across the last 5 years. We also consider the important role of European storage in a global LNG market context.
Market price signals underpin recovery
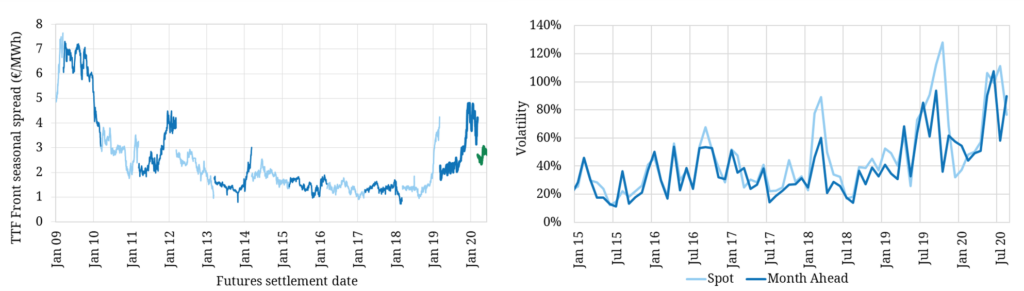
Gas storage value is driven by two key market price signals. Summer / Winter hub price spreads determine the value of seasonal flexibility. Spot price volatility determines the value of short term gas delivery flexibility. Both price signals have been trending higher across the last three years as shown in Chart 1.
This recovery in market price signals comes back to the three structural drivers we set out above. Large volumes of LNG have been flowing into Europe, pushing down summer gas prices and causing price volatility. This is exacerbated by the fact that Asia has very low levels of gas storage capacity. As a result European storage plays an important role in absorbing swings in Asian LNG demand.
The load factors and supply flexibility requirements of gas-fired power plants have been increasing across the last three years, as coal & nukes close and wind & solar grows. And price volatility driven by availability issues with ageing gas infrastructure is also becoming more prevalent.
In addition to these structural price signal drivers, Europe has had high storage inventories across the last year. This has reduced injection response flexibility during periods of lower gas prices, reducing its impact in dampening price volatility.
Seasonal spreads rose to their highest level in a decade at the start of 2020, averaging 4.9 €/MWh across Winter 20-21. Spot price volatility averaged almost 90% in 2019 (up from 55% in 2018).
Backtesting the storage margin recovery
We have several models in our toolkit that we use to value gas storage and project storage margins for asset owners and investors. Assessing storage margin using a combination of different models helps to create a more realistic view of value.
An important part of storage value analysis is ‘backtesting’ our models against historical spot & forward price data to ensure that modelled value can be achieved in practice.
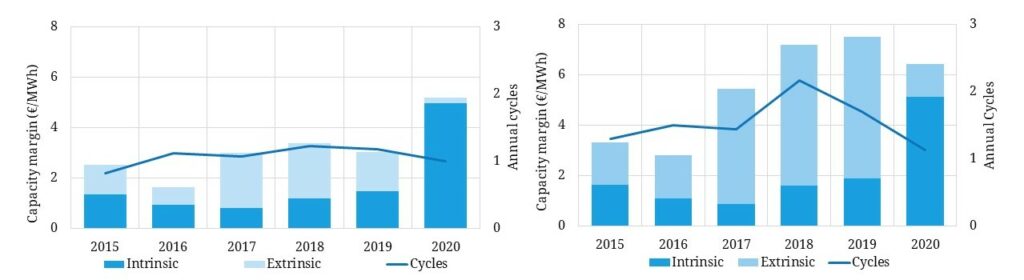
The trading strategy of the storage capacity holder is a key driver of risk & return. In Chart 2, we show backtested storage margins assuming a rolling intrinsic strategy for (i) a seasonal and (ii) a fast cycle storage asset with access to TTF
Note: the years in the chart are gas storage years, which run from April (start of the summer injection season) to March (end of the winter withdrawal season).
The backesting analysis assumes that hedging of storage capacity begins on the first trading day of the year (against observable forward prices). Then this initial position is reoptimised based on daily forward prices changes using a rolling intrinsic strategy, a transparent and commonly adopted strategy. For example for storage year 2019 (Apr 2019 – Mar 2020), forward margin is hedged from Jan 2019.
Some observations on margin evolution in the charts:
- Clear recovery for both asset types across 2017-19 years
- Intrinsic value has been increasing in line with seasonal spreads
- But… extrinsic value accounts for the majority of margin capture for both asset types
- Extrinsic value for fast cycle storage is multiples of that for seasonal storage per unit of space (but it is important to note that fast cycle capacity is more expensive to develop / buy)
- In 2019, seasonal assets saw a slight reduction in total margin vs 2018 (due to falling extrinsic margin). Margin is split ~50% intrinsic / 50% extrinsic.
- In 2019, fast cycle storage margins rose vs 2018, driven by increases in both intrinsic and extrinsic margin. Extrinsic margin represents 75% of the total margin.
It is important to note that the margin capture shown in the charts reflects a specific choice of asset configuration and trading strategy. These can be altered to test margin impact. But the underlying trend of rising margins across the last three years is clear.
A margin cross section
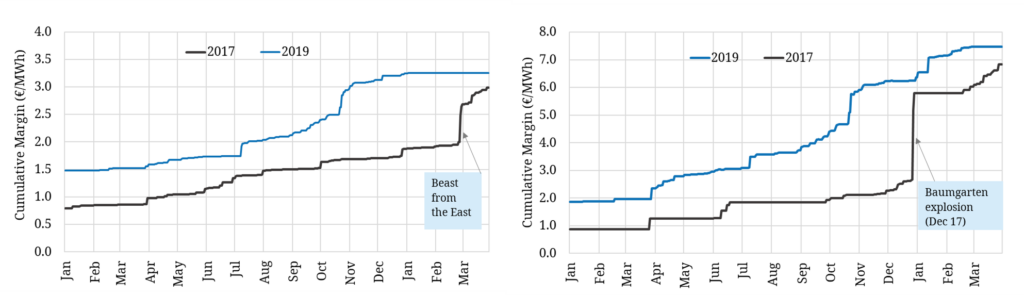
While Chart 2 shows aggregate storage margin captured in each storage year, it does not provide much insight into how that margin is earned within a given year. Chart 3 shows a cumulative build up of margin as it is generated within a given year for each asset type.
The charts show an interesting comparison between 2017 and 2019:
- In 2017 a significant portion of value for both asset types related to specific market shocks:
- The seasonal asset realised a sharp jump in margin from the more prolonged ‘Beast from the East’ weather pattern in Q1 2018 (note this is contained within the 2017 storage year)
- The fast cycle asset in contrast made a big portion of margin from withdrawing into the shorter duration price spike caused by the Baumgarten explosion in Q4 2017.
- 2019 by contrast saw a much steadier accumulation of margin for both asset types, driven by a combination of:
- Higher TTF seasonal price spreads (vs 2017) as LNG flows pushed down summer prices
- A consistently higher level of spot price volatility & lower contract price correlations, supporting steady generation of extrinsic value
This ‘cross section’ analysis of asset margin accumulation can be a very useful diagnostic tool to understand the potential future evolution of storage asset margins under different market conditions e.g. changing LNG flow patterns, higher power sector intermittency and a tightening gas market balance.
In the case of significant margin generated from market shocks (e.g. the Baumgarten fire), it is also important to challenge how market liquidity conditions impact the ability to capture value from extreme price volatility.
Outlook for margin recovery drivers
Gas storage developers in Europe are as extinct as the dodo. There has been almost no investment in new storage capacity since the middle of last decade. Europe is also steadily losing traditional sources of upstream gas supply flexibility, with declining flex from Norway (e.g. Troll), the UKCS and the rapid close down of Dutch production. These factors are slowly but surely eroding the supply of gas flexibility in Europe.
Against this backdrop of declining supply flexibility, the European gas market has become the key flexibility provider to the LNG market. Europe’s requirement to provide supply flex is exacerbated by Asian LNG demand swings given low domestic storage capacity, as seen in 2019 and 2020.
As the speed of power sector transition gathers pace, the requirement for short term deliverability flexibility from gas-fired power plants is also rising quickly. The closure of coal and nuclear capacity across Europe, leaves CCGTs and gas peakers as the dominant provider of swing flex to balance wind and solar swings in power markets.
The structural drivers of the recovery in gas storage margins across the last three years are here to stay.