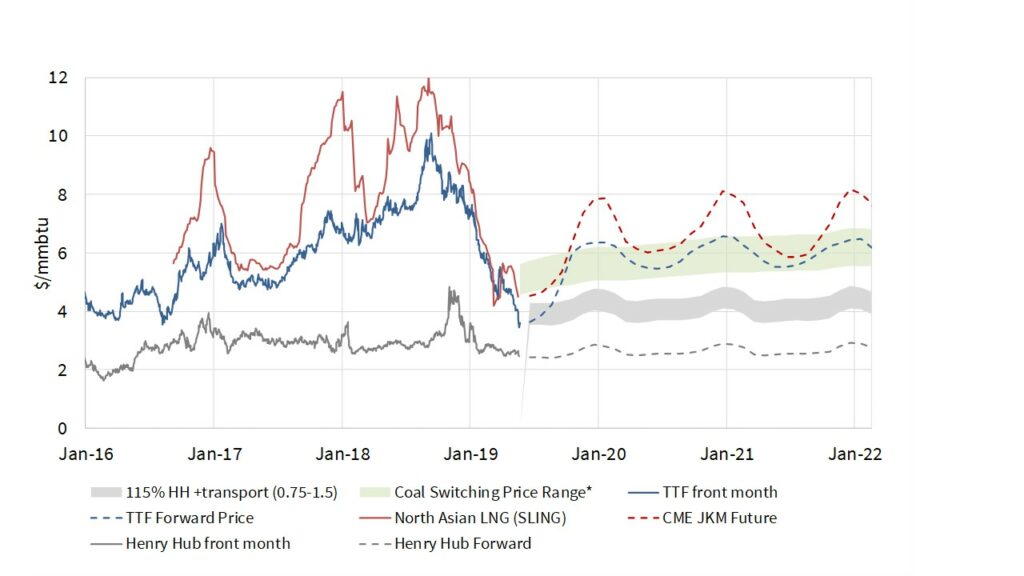
The switching dynamics of European gas for coal plants have never been more important than in 2019. Falling hub prices are tipping the competitive balance in favour of gas-fired plants. Front month TTF prices last week plunged towards 10 €/MWh (3.60 $/mmbtu) as near record volumes of LNG & Russian imports continue to flow into European hubs.
This shift in competitive balance is causing an increase in the influence of gas in setting marginal power prices across Europe. It is also helping support gas demand, allowing European hubs to absorb high gas import volumes.
The importance of relative gas vs coal plant variable cost dynamics means that a lot of attention is currently focused on switching price levels. But the concept of switching levels oversimplifies the dynamics driving the swings in gas and coal plant output. In today’s article we look at some of the practical drivers beneath a simple line on a chart, using a German power market case study.
Switching level is not just a line on a chart
The coal for gas switching price level is often drawn as a simple line overlaid on a gas price chart. This implies a clean transition from gas to coal plants as gas prices shift either side of the switching line.
In Chart 1 we show a switching range as opposed to a line. This reflects a gas price range across which CCGTs displace coal plants, given differences in plant efficiencies and variable costs. But even this significantly oversimplifies underlying swings in gas & coal plant output.
The ability of the power sector to absorb incremental gas and the importance of gas in setting power prices fluctuates in real time. This is best illustrated with a case study in Chart 2 which shows German generation output across the last 10 days in May 2019.
Chart 2: German hourly generation output by plant type (GW)
Source: Fraunhofer Institut
The variable cost competitiveness of coal vs gas plants is relatively stable across such a short time horizon. In other words, nothing of note is changing on the switching chart. Yet despite of price stability, there are three additional factors that have an important influence on the relative levels of gas vs coal output:
- Renewables output
In periods of high wind and/or solar output, both gas & coal units are increasingly being driven out of merit, regardless of fuel costs. In these periods we are increasingly seeing lignite or even nuclear units on the margin in Germany.
- Plant level dynamics
There are important factors driving output at an individual plant level that are not related to fuel & carbon prices. For example, there are minimum output levels associated with CHP offtake commitments for both gas & coal plants. There are also a range of other factors that vary widely across plants such as ramping flexibility and coal transport costs.
- Power demand
The level of power demand varies on both an intraday and seasonal basis. This (in combination with renewable output volumes) influences thermal plant load factors. If overall power demand is low then there is limited switching potential.
Relative fuel & carbon price levels clearly favour gas over coal plants in Chart 2. When thermal flexibility is required, gas plants are claiming a greater portion of the pie. But the three other drivers described above are just as important in determining how much switching & incremental gas demand volumes are actually occurring in practice.