Twice a year GasTerra auctions Dutch storage capacity. The price the market is willing to pay for this capacity provides a useful insight into the value of flexibility in the NW European gas market. And the evolution of capacity value since the first auction in 2011 tells an important story of the shift in the focus of storage value from seasonal flexibility to shorter term deliverability.
How has the value of storage capacity evolved?
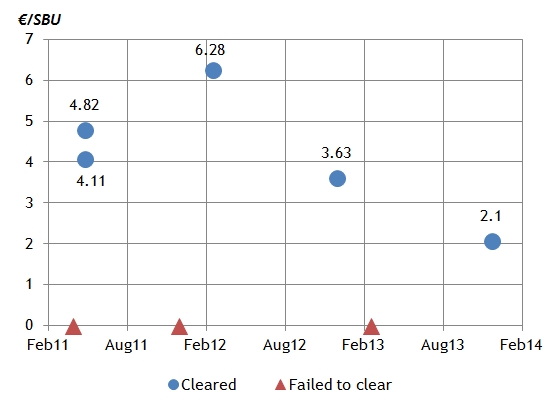
The two key market price signals that drive gas storage capacity value are seasonal price spreads and prompt volatility. So it is no surprise that the price outcomes of the GasTerra auctions have mirrored the steady decline in seasonal spreads and spot volatility over the last three years. Chart 1 shows the history of auction results, including 3 auctions where market bids failed to clear above the capacity reserve price.
The GasTerra capacity product or Standard Bundled Unit (SBU) is seasonal in configuration, taking approximately 180 days to fill. That means its value has been falling in close relationship to the decline in seasonal spreads. But with the TTF winter/summer spread hovering around an anaemic level of 1 €/MWh, the value dynamics of the GasTerra SBU are changing. In order to better understand this we look at the November 2013 auction result in some more detail.
The evolving value of storage capacity
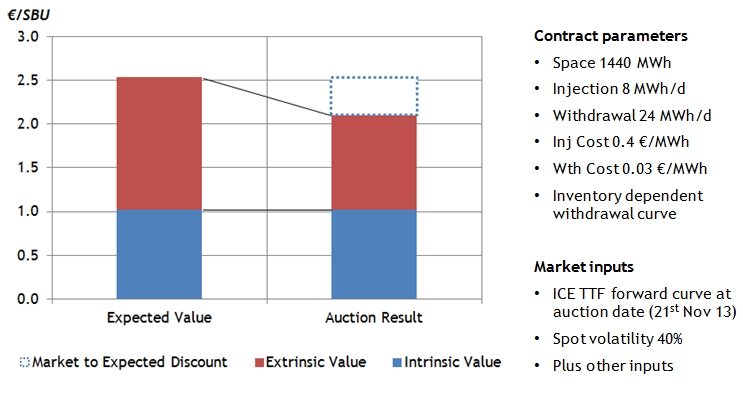
In order to interpret the Nov 13 auction result we need to model an expected value for the GasTerra SBU at the time of the auction. We can model this using the Timera Energy gas storage modelling suite along with the prevailing forward market seasonal price spread (1.2 €/MWh) and an estimate of spot gas price volatility (40%). For this exercise we apply a stochastic dynamic programming approach to value the SBU (consistent with that commonly used by trading functions in energy companies). Chart 2 shows the results.
Although the GasTerra SBU is configured towards extracting value from seasonal spreads, it is interesting to note the relatively high proportion of extrinsic value. As spreads have collapsed the focus of monetising capacity shifts to capturing value from the flexibility to respond to market volatility. Under these conditions, the value from shorter term price spikes becomes an increasingly important source of value for seasonal storage.
The impact of falling seasonal spreads has a knock-on effect, increasing the level of competition for short term deliverability, which in turn suppresses spot volatility. In other words optimised seasonal storage capacity is competing more directly against fast cycle capacity to capture the returns from spot volatility.
Chart 2 also illustrates the relationship between the modelled expected value of capacity and the value the market is prepared to pay. There is typically a discount of market value to expected value, reflecting the costs and risks associated with monetising capacity (e.g. hedging transactions costs, risk capital costs). See here for a more detailed explanation of this. The analysis in Chart 2 suggests that the market is willing to pay for about 70% of extrinsic value (assuming spot volatility at 40%).
Looking to storage deltas for further insights
To understand more about the evolving dynamics of storage it is useful to look at the monthly capacity deltas. Deltas represent the sensitivity of storage capacity value to a price change in a given period. Another useful analogy (which is not entirely mathematically correct) is that delta reflects the probability that the storage option will be exercised (via injecting or withdrawing) in a given period.
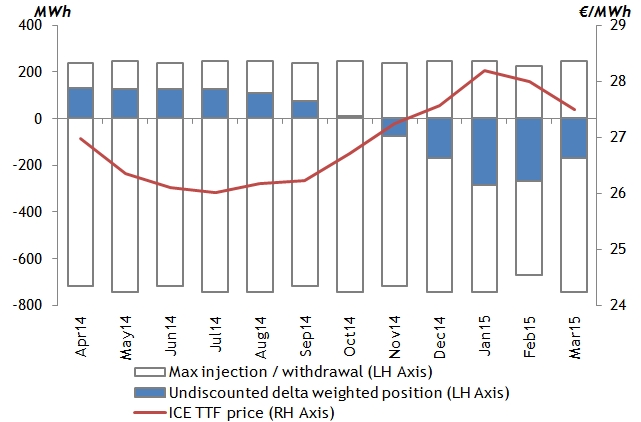
Chart 3 illustrates the GasTerra SBU deltas as modelled at the time of the Nov 13 auction, with the monthly ICE TTF futures curve overlaid.
Calculating storage option deltas (skip ahead if you are allergic to technical detail…)
Storage option deltas are complex to calculate and interpret due to the time dependent nature of the optionality. The complexity of storage valuation models means that it is not possible to calculate deltas analytically (i.e. as a direct outcome of the model).
Instead a typical approach is to use the expected or average injection and withdrawal utilisation profile as a proxy for the delta weighted position. This is generally a reasonable approximation but a more theoretically correct method is to calculate the deltas numerically. This is done by shifting the price for a given period up and down by a small amount and recalculating the storage value for each case and measuring the change in option value as a function of price. The advantage of this technique is that it can be applied to all valuation models but the key disadvantage is that it requires multiple complex calculations which may lead to performance issues.
Traders and risk managers place a high value on accurate option deltas as they provide valuable information as to the exposures arising from the capacity. They can be combined with delta positions arising from other exposures (e.g. hedges) to give an aggregated view of portfolio exposures. Traders use deltas to identify exposures and inform hedging decisions (e.g. delta hedging) and risk managers use them as exposure inputs into risk models.
The deltas from the Nov 13 auction are relatively flat across the injection and withdrawal periods. This is a direct result of low seasonal spreads and provides another view on the shift away from intrinsic to extrinsic value. If the seasonal spread was higher, there would be a stronger incentive to move gas from the lowest to highest price periods. In this case the deltas in the optimal injection and withdrawal periods would be much closer to their maximum levels (shown by the grey outlines in the chart), with an equivalent reduction in the deltas of other periods. In other words, the deltas give a direct signal of the likelihood of injecting or withdrawing in a given period.
Implications for storage asset owners
The last three years have been tough for storage owners as seasonal spreads and volatility have sunk. But there are steps that can be taken to combat adverse market conditions. Asset value can be defended without giving away upside from a market recovery. But this means being flexible and adaptive in defining a capacity sales strategy. As a simple example, GasTerra has started offering a 5 year product indexed to the Summer vs Q1 price spread, i.e. they retain the underlying spread exposure on capacity sold.
Product re-configuration is another key measure. As the market evolves, so does the value of different combinations of injection, withdrawal and space. By understanding the marginal value of each of these components, owners can construct new products or tariff structures that maximise the value of capacity sales. This is being recognised in the increasing number of non-standard product types that are being marketed as complementary offerings to the traditional SBUs.