Decarbonisation has rapidly become one of the driving forces of energy market evolution across the last decade. It is shaping the energy policy landscape, propelling rapid evolution of new technologies and spurring vast investment in new infrastructure.
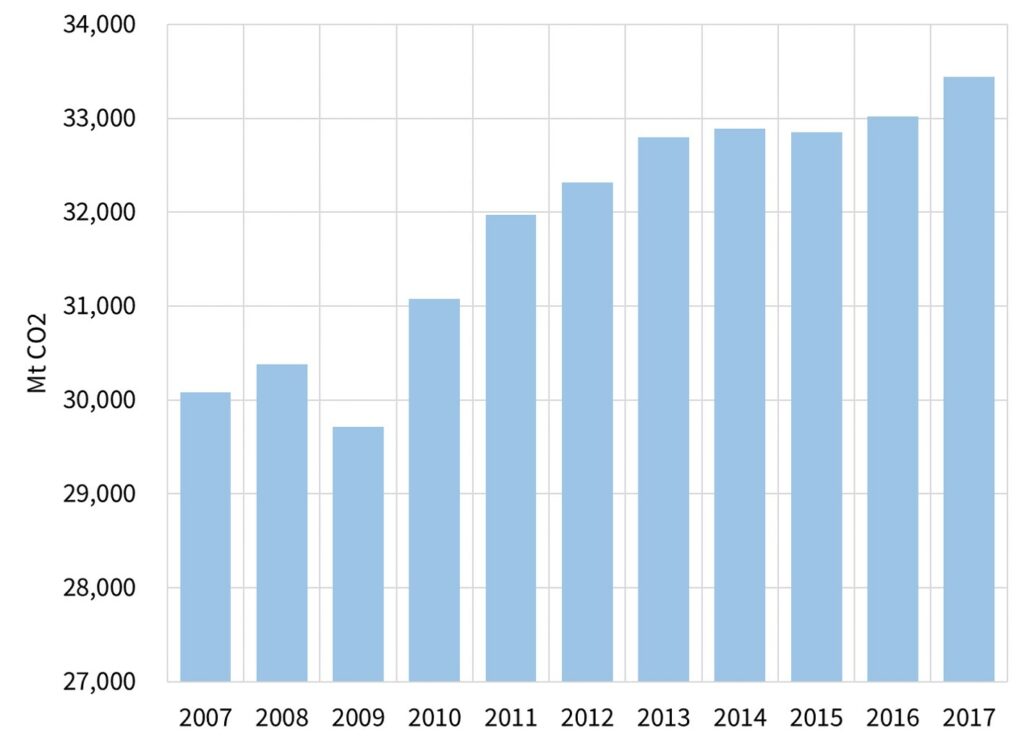
Yet at an aggregate global level there has been no decarbonisation. Global carbon emissions have risen 10% (3.1 billion tonnes) over the last decade (2008-17). After stabilising for three years (2014-16), global emissions stepped higher again in 2017 (rising 426 Mt).
The COP21 Paris agreement laid out a broadly adopted plan to address decarbonisation, with a view to containing global warming. The current trajectories of policy and technology do not look close to being consistent with achieving the sub 2 degree target.
The lack of results to date is unlikely to erode the decarbonisation agenda. Instead it increases the probability of accelerated action over the next decade. That action will likely have a magnified impact on the power sector, and in turn shape the evolution of global gas markets.
In today’s article we take a step back to try and better understand the potential impact of decarbonisation. Specifically we look at the evolution of:
- Global carbon emissions over last decade (broken down by regions)
- Generation fuel transition across the global power sector.
Global emissions in numbers
We start with the emissions evidence. Chart 1 shows the trajectory of aggregate global carbon emissions over the last decade. Chart 2 shows the breakdown of emissions across a grouping of 4 major regions.
Chart 2: Global emissions grouped by region
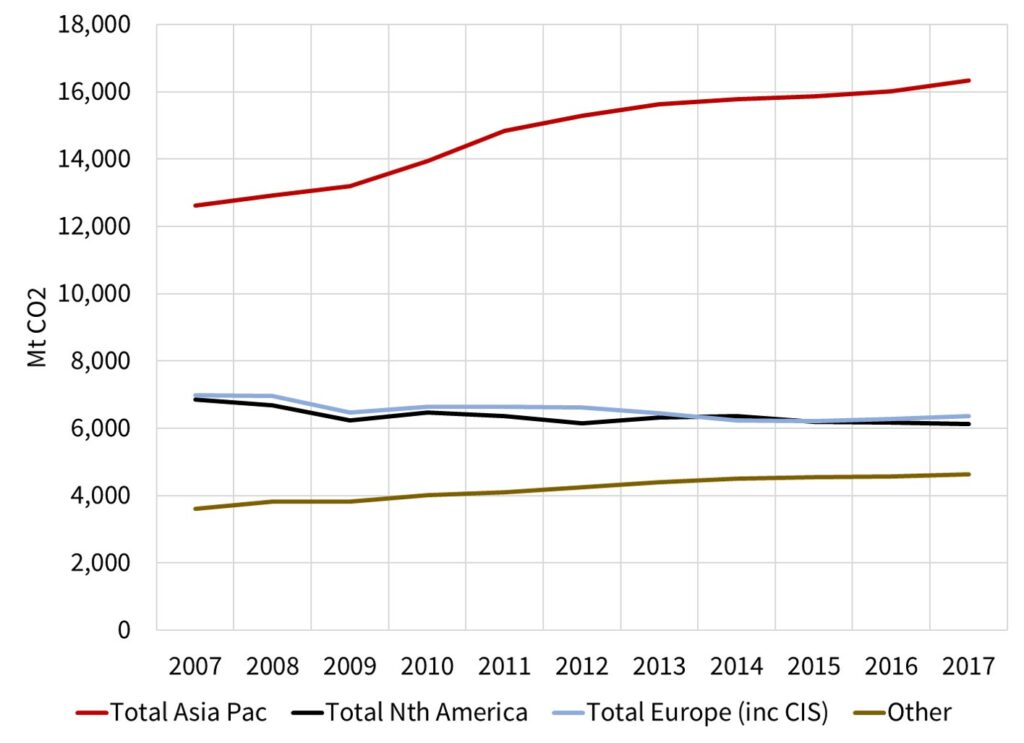
Source: BP Statistical Review 2018
The 10% increase in global emissions across the last decade does not follow a steady path. There are some interesting drivers that influence this:
- GDP growth is important, given it is fuelled by rising energy consumption e.g.
- the 2009 dip is driven by the financial crisis (particularly its impact on Nth America & Europe)
- synchronised global growth has supported rising emissions in 2016-17.
- Asia is the primary force driving the shape/growth of the global emissions trajectory. The huge emerging economies of China and India are key (although a significant portion of these emissions relate to manufacturing exports to Europe and North America).
- Coal usage is also important, particularly since it is the dominant fuel for power generation in emerging economies as well as the key fuel source for new generation capacity (e.g. the 2011-13 growth in Indian & Chinese coal plant capacity).
In contrast to rising emissions from emerging countries, emissions have declined across the more developed European and North American economies.
European carbon emissions have fallen by 10% across the last decade driven by lower levels of economics growth, gradual power sector decarbonisation and some improvements in industrial emissions. North American carbon emissions have fallen 8%, largely the result of the shale revolution driving down gas prices and eroding coal generator load factors.
The problem at a global level is that these modest reductions in Europe and North America are being overrun by much faster emissions growth from emerging economies in Asia (+26%) and ‘Other’ regions (+21%, predominantly Latin America).
Decarbonisation momentum
The COP21 Paris roadmap stops short of being a cohesive policy implementation plan to drive global decarbonisation. The policy response across signatory countries has been somewhat sluggish and disjointed, not helped by Trump’s attempts to stall progress.
Yet COP21 has marked a shift in the balance of global political and business wills in favour of decarbonisation. This transition is being supported by market price signals e.g. declining cost of capital for renewables, rising cost of financing coal and the substantial increase in climate change related insurance premiums.
Companies across the US, Europe and Asia smell huge profit opportunities from growth in decarbonisation driven investments such as renewables, CHP, storage, EVs, SMR nukes, smarter appliances & enabling software. Capital markets do too.
5 conclusions on decarbonisation & power sector evolution
The power sector is at the frontier of global decarbonisation efforts. From a technical and cost perspective, power is easier to decarbonise than heat, transport & industry. The sharp impact of market price signals on generation shares can facilitate rapid adjustments (e.g. US shale, UK coal). Power sector decarbonisation also sets up the electrification of other sectors (specifically transport & heat).
Chart 3 shows an interesting analysis of the evolution of generation shares across the global power sector, using data from BP’s latest Statistical Review.
Chart 3: Global electricity generation by fuel share
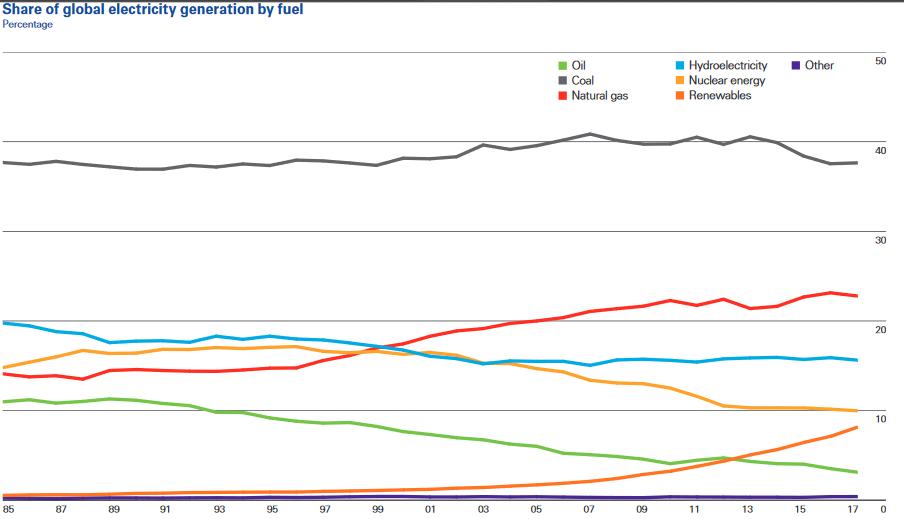
Source: BP Statistical Review 2018
Drawing on this chart, we believe there are five key conclusions that can shape a pragmatic approach to decarbonisation over the next decade.
- Close coal plants – Coal represents the highest share of global generation (38%). It also has the highest carbon intensity (aside from some forms of oil, already in rapid decline). Yet coal’s share of the global generation mix is unchanged over the past 10 years. Closing coal not nuclear should be the global policy focus.
- Retain & replace nuclear – The declining share of nuclear across the last decade is driven by post Fukushima reactor closures in Japan and Europe. This has offset much of the carbon impact of renewables. Yet closures look set to continue across next decade. It is much easier to keep existing baseload low carbon capacity than to try and replace it. Extending reactor lives may also bridge the gap to safer and more scalable Small Modular Reactor (SMR) technology from the 2030s.
- Accept gas transition – Fighting gas at the same time as coal (& nuclear) is counterproductive. A meaningful switch from coal to gas generation in emerging economies over the next decade, particularly in China and India, buys time for renewable & new nuclear roll out and broader technology innovation. Local pollution problems may be as big a driver of the switch to gas as decarbonisation. Gas leaves a second phase carbon problem mid-century, but it is not insurmountable.
- Engage demand – Huge untapped sources of demand side efficiency and flexibility have the potential to substantially reduce the problem of emissions from electricity supply. Part of this depends on rapidly evolving smarter technologies & software. But the largest constraint is regulatory reform to enable & incentivise greater efficiency & participation (e.g. via developing market structures & price signals). This is key to supporting incremental demand growth from electrification of the transport & heat sectors.
- Accelerate renewables – Renewables have risen to 8.4% of the global generation mix in 2017, with an accelerating growth rate. Technologies are improving (including storage as a compliment to intermittent renewables), costs are falling and capital is flooding in. ‘Stand alone’ renewable investment may further accelerate growth in the 2020s. But renewables are not enough to be the primary driving force behind global decarbonisation. As a result, expect a policy shift to focus on 1. 2. 3. & 4. in parallel.
In summary, the decarbonisation engine is relying too much on one cylinder… renewables. Watch out for a transition to other cylinders sharing more of the load across the next decade. This will have an important impact in shaping the evolution of both power and gas markets.
This is our last article before the summer break. We will return in mid-August to look at the evolution of carbon emissions in Europe and the implications for European power markets. In the meantime we wish you a sunny and relaxing summer.