Global gas prices are surging. Asian & European spot prices have tripled since Q2 2020. US Henry Hub prices are now 40% higher than the start of the year, substantially above pre-Covid levels.
“We have just experienced historically low gas prices in 2020…
.. but price risk is rapidly shifting to the upside”
The rapid rise in TTF gas prices is fuelling a parallel surge in European power prices. Gas-fired power plants are the primary driver of marginal power prices across Europe. Plant variable cost increases driven by rising gas prices are being passed through directly into higher power prices.
Since early Q2 this year, we have been ‘beating the drum’ on a major turning point in the European and global gas market balance. We received aggressive push back on this recovery call when TTF prices were below 10 €/MWh and JKM below 4 $/mmbtu. But across the last 3 months the objective barometer of market prices is confirming our analysis.
In today’s article we look at the current state of balance in gas markets and consider what may be coming next.
V-shaped global gas price recovery
There has been heated debate this year as to the potential shape of post-Covid global economic recovery. Different theories have been presented on shape, for example V, W, bath tub, square root or even Nike swoosh shapes.
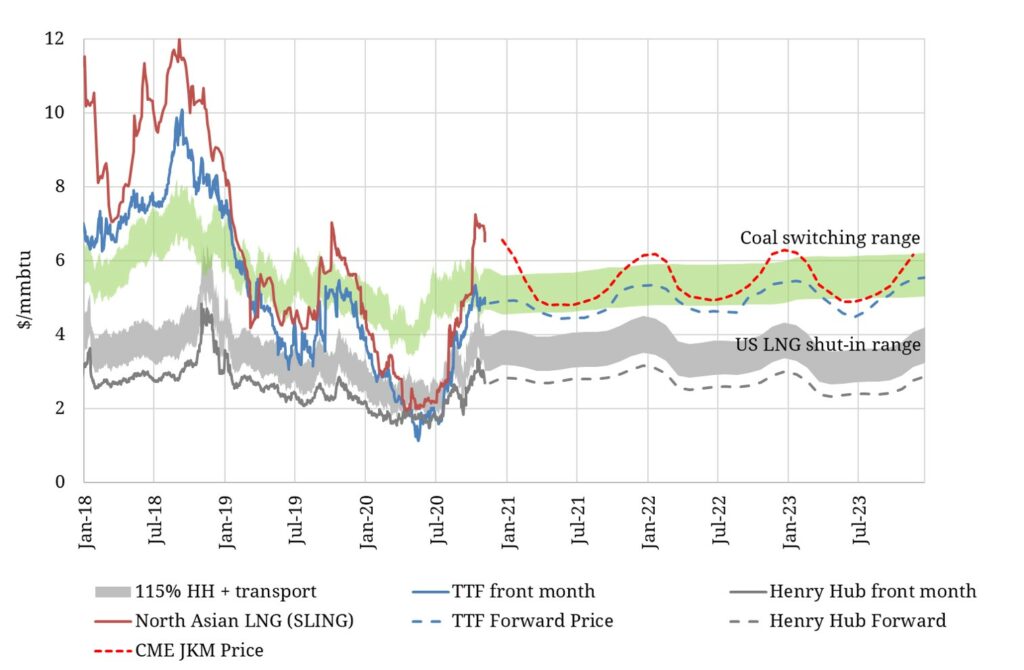
Projecting the shape of economic recovery is an uncertain and complex task that is beyond our expertise. But it is hard to argue with the V-shape of the recovery in Asian & European gas prices in Chart 1.
The rapid rise of prices up the right hand arm of the V, reflects a gas market transitioning from acute oversupply (Q1 & Q2) to a more balanced state (Q3 & Q4). As a result, there is a major shift underway in marginal pricing dynamics.
In an oversupplied market, US LNG export shut in dynamics are the key driver of gas prices in Europe and Asia (e.g. Summer 2019 and most of 2020). In a more balanced market European power sector switching dynamics act to anchor prices at TTF and JKM (e.g. most of 2017-18 and Winter 2019).
Forward curve wedged between switching & shut in ranges
As the European gas market recovers into Q4 2020, switching is coming back into focus as a key marginal price driver. The green shaded band in Chart 1 shows the core coal for gas plant switching price range.
The 2020 slump in gas prices has seen most European coal plants out of merit on a variable cost basis versus CCGTs. However the sharp gas price rally over the last three months has lifted the TTF forward curve to re-engage with the lower boundary of this switching range.
The switching range acts as important resistance for rising gas prices as can be seen in Chart 1. As prices increase into this range, CCGT load factors start to decline, reducing gas demand and easing market tightness. The current TTF forward curve is consistent with significant switching over the winter months (with higher power demand & gas prices), but with CCGTs dominating coal in the summer months.
While the switching range acts as TTF price resistance, the US export shut in range (shown as the grey band in Chart 1) acts as price support. This is particularly the case across the lower demand summer months. If prices fall into the US shut in range, then cargo cancellations from the more expensive export trains act to reduce LNG flows to Europe, supporting the market.
Chart 1 shows that Summer 2021 forward prices levels are now above the US shut in range. Beyond 2021, TTF & JKM forward prices continue to diverge from the US as the LNG market balance tightens.
Gas markets tightening into 2021
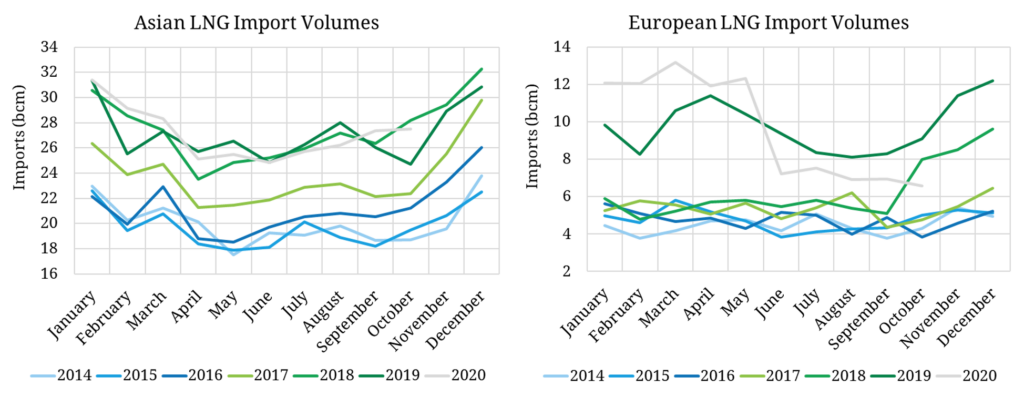
Asian LNG demand has been remarkably resilient in 2020 given the Covid driven economic shock. Aggregate 2020 Asian demand is tracking at a similar level to 2019 as shown in the left hand panel of Chart 2. This aggregate number is a combination of demand growth in China, India & smaller developing markets versus weakness across the 3 large traditional markets (Japan, Korea and Taiwan).
The right hand panel of Chart 2 shows European LNG import volumes. These were running near to record levels across Jan – May 2020 but have fallen sharply since.
The initial import decline in Q2 related to large volumes of US cargo cancellations as export capacity was shut in in response to low netback prices. But European LNG flows have remained weak into Q3 – Q4 as rising Asian demand has seen supply diverted to Asia.
JKM vs TTF price spreads have risen sharply across the last few weeks (as can be seen in Chart 1). This reflects a market price signal from Asia that more supply is required into winter. Rising price spreads are also directly related to a surge in spot vessel charter rates which have risen above 100k $/day as longer average voyages act to tighten the shipping market.
Watch for further tightening 2022-25
Global LNG demand growth has been weak across 2019 and 2020. It is unlikely that we see a third year of weak growth in 2021, particularly with the imminent roll out of a vaccine to support economic recovery.
However there remains substantial uncertainty around just how fast LNG demand may grow this decade. The answer lies in Asia. And the resilience of developing economy demand in 2020, particularly in China and India, suggests that demand growth may return to levels more consistent with 2016-18.
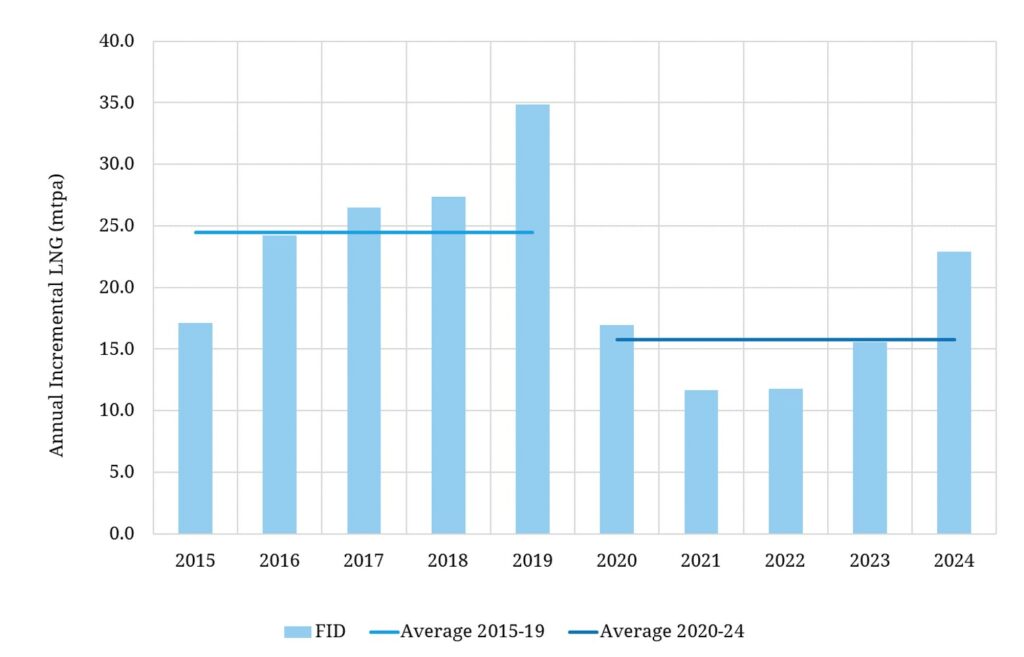
Demand aside, there is another structural force acting to tighten the LNG market balance across 2022-25. The four to five year development lead times on new supply projects mean that we have good visibility of supply growth out to 2025. And it substantially lower than the last 5 years as shown in Chart 3.
Annual incremental supply growth across 2015 – 2019 averaged 24.5 mtpa. Average supply growth across the 2020 – 2024 period is set to fall 36% to just 15.8 mtpa.
This fall in supply growth is set to have a substantial impact in rebalancing the LNG market by the mid 2020s, even before considering rising demand. Add annual demand growth of somewhere between 10 to 25 mtpa and the global gas market may be very tight indeed by 2023-34.
Even though we have just experienced historically low gas prices in 2020, price risk is rapidly shifting to the upside. And the ability of LNG supply to respond before 2025 is next to nothing.