A cold start to the northern winter is breathing some life back into global gas prices. There has been some excitement this month as Asian spot LNG prices have rallied back to around 7.10 $/mmbtu. While this is a steep discount to winter prices over the 2011-14 period, it still represents a sharp rise from prices around 4 $/mmbtu in Q2 this year. But what has this rally meant for the spreads between regional gas prices?
Convergence is alive and well
Some of the Q2 vs Q4 price rise is seasonal in nature (summer vs winter). But the Asian gas price recovery also mirrors a broader underlying recovery in both European and US gas prices. The UK NBP has rallied from below 4 $/mmbtu in Q2 to around 6 $/mmbtu currently. US spot gas prices have doubled from around 1.50 $/mmbtu to 3 $/mmbtu.
Throughout these significant move higher in regional prices, strong global price convergence forces remain. The spread of Asian over European spot prices remains constrained by variable transport cost differentials (at ~1.00-1.50 $/mmbtu level). This is illustrated by the Q4 recovery in Asian spot prices having been capped by the diversion of flexible LNG supply away from Europe.
The spread between the US and European prices is less strongly influenced by the forces of physical cargo arbitrage. Sabine Pass is so far the only active US exporter of LNG, with the majority of first wave export capacity due online in 2018-19. Yet the price spread between the US Henry Hub and UK NBP remains similar to levels of Q2 (albeit at significantly higher absolute price levels). Let’s take a more careful look at this relationship.
Trans-Atlantic price spreads
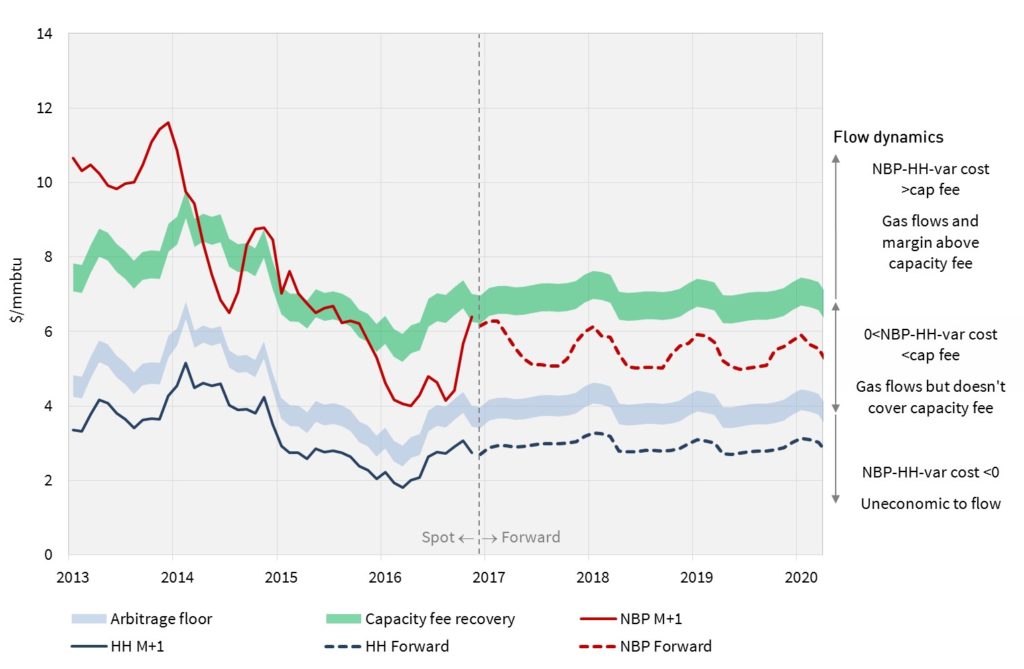
In Chart 1 we show an updated view of the relationship between European and US gas prices that we published back in April.
The Trans-Atlantic front month spread currently sits over 3 $/mmbtu. This can be contrasted with an average forward spread closer to 2.50 $/mmbtu along the Henry Hub vs NBP forward curves.
The wider current spot price differential partly relates to more pronounced seasonal price spreads in Europe compared to the US. Seasonal spreads are close to historically low levels in Europe, but the spreads in the US are even lower given an oversupply of seasonal flexibility.
European hub prices have also been supported this year by the sharp rally in coal prices. This increases the gas price levels at which gas for coal plant switching takes place in the power sector, creating additional gas demand.
Further along the curve, forward hedging of US export contract volumes is helping keep any European vs US price divergence in check. But in our view European hubs are not yet converged with Henry Hub on a variable cost basis as we set out in April. In other words current forward curves still reflect positive arbitrage value above the true non-sunk variable costs of moving LNG between the Gulf Coast and North West Europe.
Lessons learned from 2016 price dynamics
We finish this week with three factors that have been illustrated by the events of 2016:
- Price vs spread level: The global price rally since Q2 2016 demonstrates how the current LNG glut is driving lower regional price spreads (i.e. global price convergence), rather than lower absolute price levels. Underneath the rally this year has been a fundamentally driven recovery in Atlantic Basin hub prices that has helped support a move higher in global prices.
- European anchor: The influence of Europe as a market of last resort is not dependent on a surge in LNG import flows. LNG import growth this year has been somewhat below expectations, given robust pipeline flows from Russia, North Africa and Norway. But European hubs remain the key price setting influence for Asia (& other importing countries), given the diversion flexibility of European LNG supply.
- Henry Hub influence: Growth in the influence of Henry Hub on global prices does not depend on high volumes of physical arbitrage. Relatively few Sabine Pass cargoes have landed in Europe. But despite this European hub prices remain the key spot price benchmark for US export flows. And the hedging of forward US export capacity is strengthening the Henry Hub vs NBP forward curve relationship.
Approximately 30% of the committed volume of new LNG liquefaction capacity to be delivered between 2015-20 will have been commissioned by the end of 2016. The influence of the three factors above should continue to strengthen as the LNG market absorbs the remainder of this new supply.
Article written by Olly Spinks and David Stokes