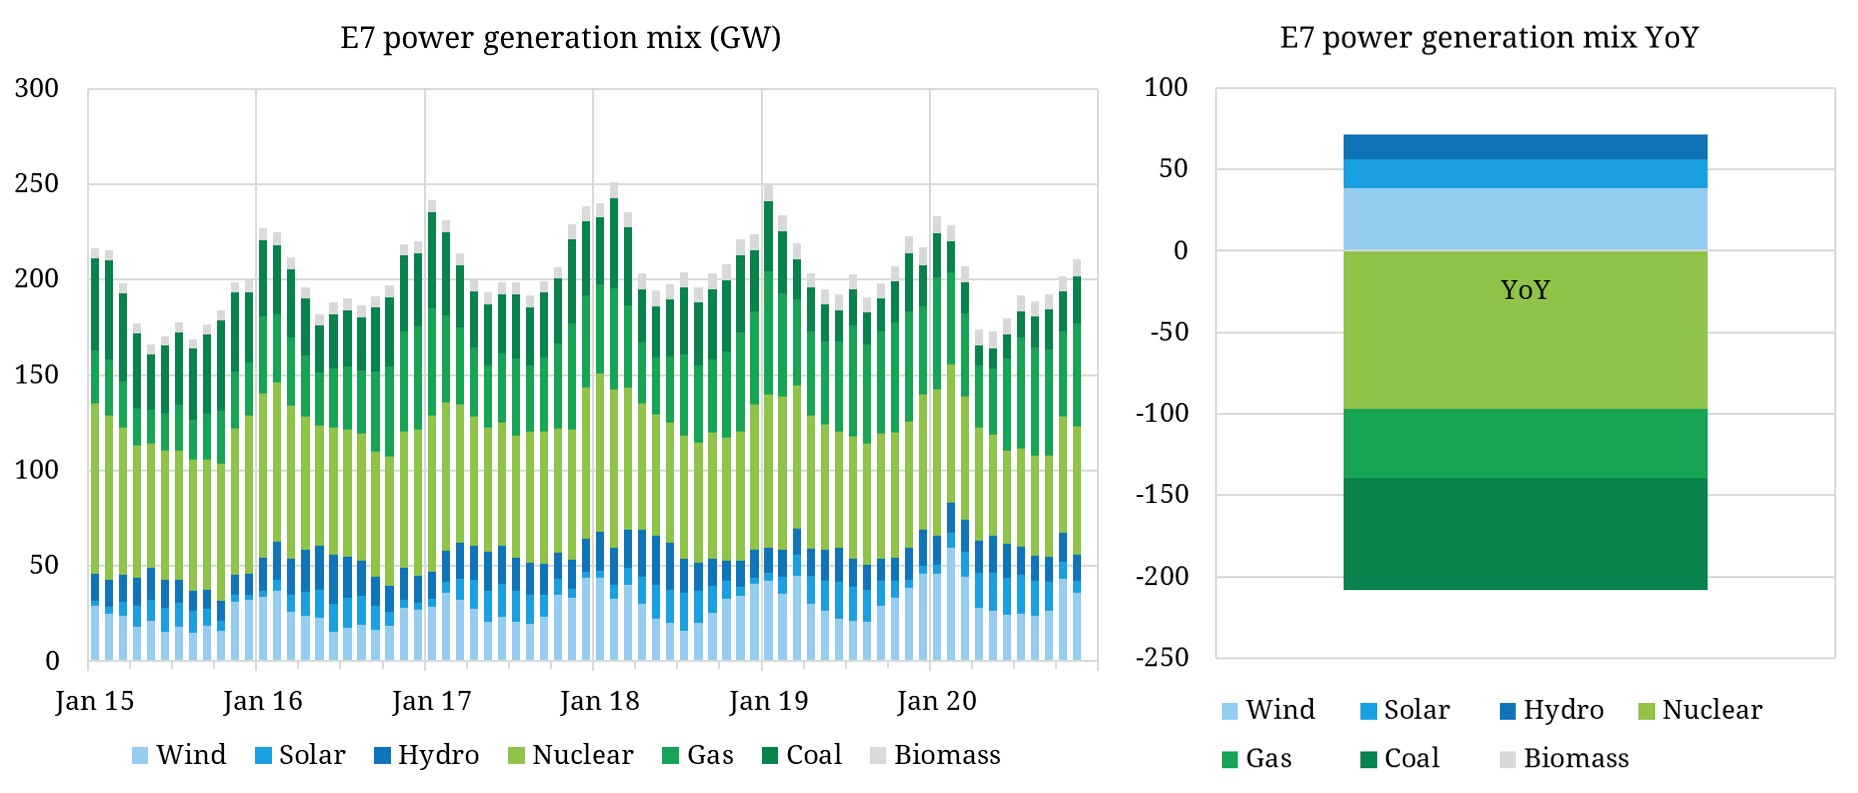
The left hand panel of the chart shows the evolution of average monthly generation levels (in GW) across 7 key power markets in Western Europe (DE, FR, NL, BE, UK, ES & IT). The right hand panel shows a breakdown of year on year supply differences by generation type (2019 vs 2020). The supply response to lower 2020 demand has come largely from lower EDF nuclear output, with higher renewable generation across the board also eating into conventional gas and coal generation. Gas generation sees a relatively lower fall as low prices into the summer incentivised gas to coal switching.
How power markets have absorbed the 2020 shock