The path to decarbonisation of European power markets depends on wind more than any other technology type. A key challenge in facilitating the effective deployment of wind capacity is system balancing.
“UK power system balancing system costs increased 48% year on year in 2021”
By 2030, Western Europe may experience more than 200GW intraday swings in renewable capacity output. Solar intermittency is by nature more predictable and easier to manage. But wind output across NW Europe is relatively highly correlated and presents a huge challenge for system operators as they evolve network management capabilities.
In today’s article we look at data from the UK to quantify the impact of accelerating wind deployment on system balancing costs. We also set out 4 grid management challenges that are driving up system balancing costs.
Surge in UK balancing costs
UK power system balancing system costs increased 48% year on year in 2021 to £2.65 bn. This was not an outlier year. Balancing costs across the first 4 months of 2022 are up another 92% vs 2021.
The factors contributing to rising balancing costs are:
- Increasing renewable penetration
- Thermal asset closures (& outages)
- High power prices.
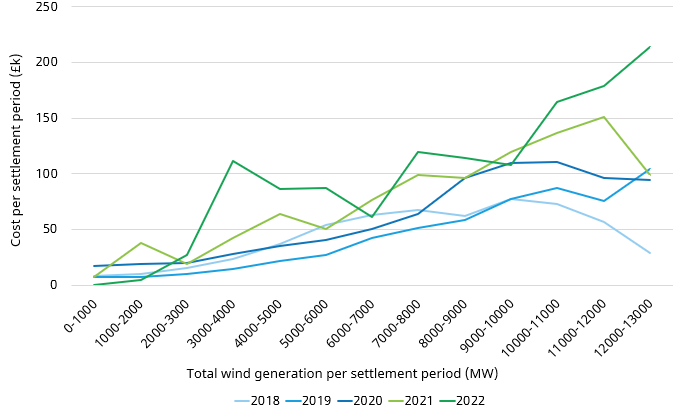
Wind curtailment is playing a particularly important role in driving up balancing costs. Chart 1 illustrates the strong positive correlation between periods with higher wind generation (horizontal axis) and system balancing costs (vertical axis).
What system actions are driving up costs?
Let’s consider 4 categories of actions that National Grid (as System Operator) is taking to support balancing of wind.
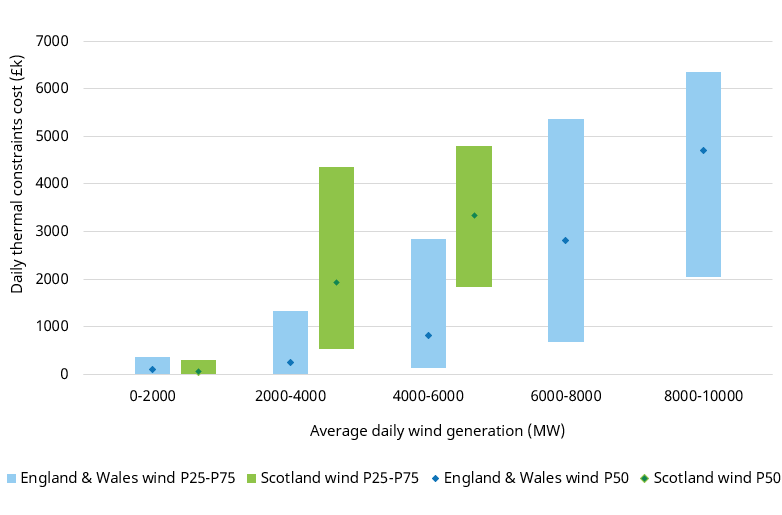
1.Thermal constraint management
A large proportion of UK wind is connected in Scotland. This is causing Grid to take balancing actions to alleviate transmission constraints (to flow power south), by curtailing wind output in the north and buying equivalent volumes of production further south (e.g. from gas plants).
As an example a particularly recent windy day on 20th Feb 2022 during Storm Eunice saw a £15.2million thermal constraint balancing cost across a 24 hour period.
Chart 2 shows the strong correlation between thermal constraint costs (vertical axis) and wind output volumes (horizontal axis).
- Voltage constraint management
During periods of high wind generation output, power prices and spark spreads (gas plant margins) decline. This results in lower volumes of economic dispatch of thermal assets, particularly in offpeak periods. In order to maintain adequate voltage support, Grid needs to pay (‘buy on’) thermal units, typically at a premium price. This can either occur in the BM or via contracting ahead of real time dispatch. The additional thermal production volumes are balanced by Grid curtailing wind (i.e. paying wind not to generate).
- System inertia management
An adequate level of system inertia is a key element of the stable operation of power systems. It has traditionally been provided by ‘spinning’ thermal assets (e.g. gas & coal plants) and acts as a key shock absorber in case of a sudden change in system frequency (e.g. from a major outage).
Inertia management is becoming more challenging as wind & solar displace coal & gas plants. This is causing Grid to take actions to procure adequate inertia services via:
- Procurement of ancillary services e.g. Dynamic Containment
- Reducing largest loss e.g. trading on the interconnectors to reduce the level of import into the GB market
- Contracting new forms of low carbon inertia support; Grid have recently announced ten 10-year contracts starting in Apr 2024 e.g. with synchronous condensers and grid forming converters.
- Infrastructure investment
Some of the system issues caused by the transition to high renewable penetration require more structural infrastructure investment to resolve. These include transmission network investments undertaken by Grid e.g. HVDC links and line upgrades. They also include Grid contracts which support external investors developing infrastructure e.g. via the Constraint Management Pathfinder program targeting alleviation of major network transmission constraints.
Balancing cost burden shifting from generators to suppliers
Historically Balancing Services Use of System (BSUoS) charges (driven by the 4 categories above) have been split between generators and suppliers. As of Apr 2023 the cost burden will be fully borne by suppliers.
This change impacts the level of power prices in the GB market given BSUoS is currently a variable cost component for generators i.e. is passed through into marginal power prices. As of Apr 2023, marginal generator variable cost reductions should flow through via lower power prices (all else being equal). However the impact is relatively small: around 5 £/MWh against power prices currently near 200 £/MWh.
Under both the current and new charging rules, the increasing costs of system balancing are ultimately passed through to end consumers. This is clearly challenging in an environment of already high consumer bills given elevated commodity prices. Over time, as the investment economics of wind & solar improves, policy makers are likely to increasingly push these balancing costs back onto renewable asset owners & investors.