Trading businesses act as the key commercial hub for most large energy companies. They provide capabilities such as market access, price signals & asset valuation services. Most importantly they aggregate portfolio exposures, monetise value & manage risk.
“In extreme conditions ‘reliable’ correlations break down”
In this role, trading & risk management functions are the frontline defence of an energy company against the impacts of extreme market volatility.
The level of volatility in European power & gas markets across the last year has been an order of magnitude higher than anything experienced in history. This is causing some major issues within trading businesses, which in many cases have governance frameworks, systems / processes and credit facilities that were not designed to cope with such a volatility shock.
Over The Counter (OTC) liquidity has dried up in European gas and power forward markets, with counterparties at each other’s credit limits, preventing all but short term trades. Liquidity remains on key exchanges (e.g. CME, ICE, EEX) but initial margin requirements have increased 4 – 5 times due to volatility, substantially increasing the cost of trading.
This has had major impacts on the ability of energy companies to manage portfolio risk. How far out to hedge a generation asset or an LNG portfolio used to be a matter of market risk appetite, now it’s as much a matter of liquidity risk management.
In today’s article we explore 5 areas of trading business activity that we are seeing being impacted by current market conditions.
1.Risk capital & limit setting
Portfolio risk can most simply be characterised as ‘Risk = Exposure x Volatility’. For a given set of exposures, an increase in market volatility acts to drive up portfolio risk. If this increase in volatility is rapid and large, then portfolio risk surges as many companies have experienced since Summer 2021.
In the case of proprietary or speculative trading portfolios, risk exposure can be scaled back via liquidations and position sizing. But this is often not the case for large energy companies which have core asset exposures that cannot easily be liquidated or fully hedged.
If core portfolio exposures cannot be significantly reduced, extreme volatility results in a requirement for much higher risk capital allocation (& credit facilities) just to support core commercial activity. This is a major draw on company balance sheets & liquidity reserves and has contributed to a requirement for energy trading businesses to increase credit facilities or raise capital.
A prominent recent example of this was Uniper securing an €8bn credit facility from its shareholder Fortum as well as a further €2bn from KfW (a state bank). Other European utilities and commodity traders have faced similar issues.
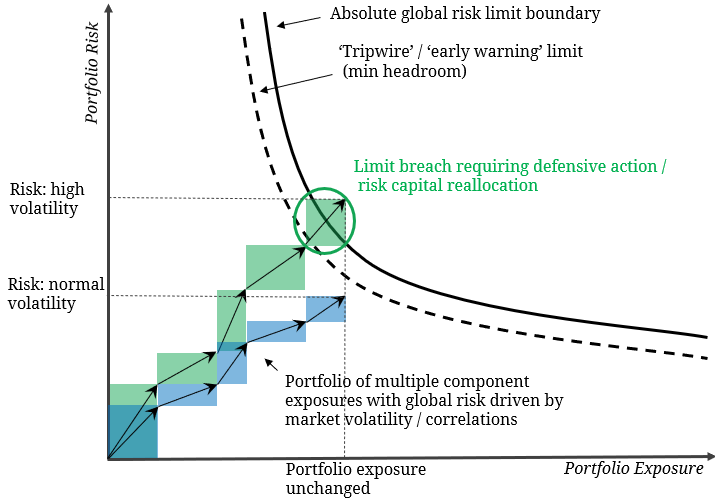
As market prices & volatility soar, risk capital & limit capacity effectively becomes more scarce requiring dynamic allocation across portfolios to support core business while effectively managing risk within limit boundaries.
Chart 1 illustrates how portfolio exposure is built up via aggregation of component exposures, which sit within a risk limit boundary. A surge in market volatility acting on the same underlying exposures, acts to increase portfolio risk and can breach the risk limit boundary.
Navigating market shocks requires strong but flexible risk governance, policies & processes. Effective trading businesses are ones with clear policy guidelines under which traders & risk managers work proactively together to manage available risk capacity as market conditions change.
2.Exposure measurement & management
Energy portfolios are typically rich with:
- partially offsetting asset exposures e.g. retail vs generation exposure in a power portfolio
- correlated spread exposures e.g. TTF vs JKM exposure in an LNG portfolio
- basis risks e.g. hedging Italian PSV gas exposure with TTF forwards.
Measurement of correlations, offsetting exposures & basis risks becomes very important as the absolute size of exposure increases with rising price levels and price volatility. This has been a source of much trouble over the last year.
Take for example a LNG portfolio which owns cargos directed at Europe, which are hedged via TTF futures but not yet physically sold. TTF normally tracks NW European LNG spot prices closely. But the recent aggressive inversion of the JKM vs TTF spread has driven a significant basis to open up, with NW European spot prices trading at a 2 $/mmbtu discount to TTF futures.
Managing exposures under market shock conditions can also be difficult. Consider a portfolio with German CCGT exposure, effectively a strip of call options on the German Clean Spark Spread (CSS). In Dec 2021 as forward peak power prices spiked above 500 €/MWh at the same time gas price volatility surged, there were rapid changes in correlation & volatility of legs of the CSS. This made the quantification of robust exposure & extrinsic value calculations very difficult, as well as impacting trader’s ability to delta hedge exposures and manage offsets against other exposures within the portfolio.
In very extreme conditions, ‘reliable’ correlations can break down. Previously uncorrelated asset classes can also become correlated against you as was the case in the 2008-9 financial crisis.
If risk measurement models do not effectively account for correlations & offsetting portfolio exposures it can either result in:
- Overstatement of risk exposure, in some cases leading to limit breaches, penal liquidation / hedging and the crystallisation of losses
- Understatement of exposure, in some cases leading to much larger realised P&L deviations than anticipated.
Correlation assumption issues within risk measurement models are not easy to rectify in the eye of a storm, yet they can have many € millions of tangible value impact for portfolio managers.
Small unmeasured or unhedged exposures can also result in substantial losses under conditions of extreme volatility. Even when calculated asset exposures are reasonable, they can be difficult or very expensive to hedge in practice due to poor market liquidity & price gaps.
3.Historical calibration of valuation & risk models
Historical calibration is not much use when there is no historical precedent. If you are unconvinced that there is no precedent for the European gas & power market volatility of 2021, please see here for why we respectfully suggest you’re wrong.
It is particularly common to calibrate stochastic price simulation models with historical prices. If realised prices & volatility are much higher than those in the historical data set, risk models underestimate exposure as well as potential P&L swings. In other words, realised observations are outside the left and right tails of simulated price distributions.
This has also been a key issue across the last year. It is difficult for senior management to trust risk models that cannot generate outcomes that are being observed in reality. As well as calibration issues, this can also be caused by models not being properly designed & tested for absolute price & volatility levels that seemed implausible when they were being developed.
Inadequacies in risk measurement are not just theoretical issues. They can for example have a big impact on theoretical vs real portfolio risk exposure, limit headroom and risk capital utilisation.
4.Effective risk analysis
Risk within energy companies is typically governed by some combination of limits underpinned by:
- Earnings or profit at risk (EaR) – for core exposures with extended holding periods
- Value at Risk (VaR) – for more liquid trading exposures
- Stop Loss & Volume limits – to manage P&L swings and exposure sizing
Market conditions of 2021 have in many cases exposed the shortcomings of these measures. Under pressure, both EaR and VaR suffer black box trust and transparency issues e.g. the ‘correlation & calibration’ problems we set out above.
In these conditions, simplicity often trumps (or at least complements) complex models. Some useful techniques that can be used to support senior decision making under conditions of market stress are:
- Portfolio stress tests – testing impact of plausible ‘what if’ scenarios from current observable market conditions
- Reverse stress tests – what market conditions could cause a particular adverse portfolio outcome e.g. limit breach, P&L deviation, working capital event
- Testing and better understanding boundaries and inflection points in portfolio exposures (particularly important with correlations / offsets / basis risk)
- Use of multiple valuation approaches to bound large complex exposures, as well as having a clear view of:
- Intrinsic value (vs observable market prices)
- Expected extrinsic value vs P10 / P90 distribution (i.e. tail risk).
Extreme intraday price volatility has also uncovered some uncomfortable dependences on ‘end of day’ closing price data. The intraday TTF price spike in Oct 2021 from 100 to 160 €/MWh (and associated power price spikes) is a good example. Real time risk measurement & limit tracking relies on real time price data. This doesn’t just mean real time price curve feeds but also the incorporation of intraday price data in model analysis & calibration.
5.Last but not least… credit
So far we’ve focused on market risk, but some of the biggest issues of the last year have been credit & collateral related. High absolute price levels and volatility have seen credit exposures explode as:
- the mark to market value of contracts has surged i.e. large ‘in the money’ & ‘out of the money’ positions open up
- the credit risk of counterparties has been impacted by market stress.
Actual credit events have been focused on smaller retailers with inadequate hedge cover. Most large utilities, producers and commodity traders have been protected from volatility by structural portfolio length in underlying commodities (& relatively strong balance sheets). But this doesn’t protect from large exposures to less credit worthy counterparties e.g. LNG buyers in developing markets.
One of the biggest challenges has been a huge increase in margin requirements with exchanges, particularly initial margin calls, as well as collateral requirements for OTC contracts.
Take an example of an offtake strip of 6 US LNG cargos per year for 3 years, indexed to Henry Hub but hedged via TTF futures. A 5 $/mmbtu move higher in the TTF vs HH spread is the equivalent of a $333m loss on the TTF futures hedge. The negative mark to market on the TTF futures is offset by an equivalent gain in value of the physical cargoes, but is still results in substantial margin calls.
Funding for initial margin collateral balances, now needs to be planned into any hedging strategy, as well as the amount of cash/short-notice funding facilities to keep in reserve for margin calls. Reserve management also needs to cover the risk of shock margin calls (as experienced by anyone short TTF futures on 21 Dec 2021).
This is having major working capital implications, placing a strain on liquidity and an urgent requirement to expand credit facilities & cash revolvers. This can be difficult for businesses where trading is not a dominant focus e.g. Board & shareholders of relatively conservative utilities becoming nervous of emergency expansion of credit access to support trading activities.
Inability to access market liquidity due to credit constraints can also act to compound portfolio stress e.g. from not being able to hedge / manage risk and substantially increasing transactions costs.
5 basics that underpin confidence
At Timera, we live and breathe complex stochastic valuation & risk models – it is our core focus. But when the tide goes out in a market crisis, it is often the basics that result in the unpleasant experience of discovering your pants are down.
What are 5 things that underpin the confidence of the CRO / CFO / Trading & Risk Managers in their ability to manage portfolio risk on a day to day basis?
We would argue a clean & accurate view of the following:
- Market position & exposure (including an understanding of components & correlations)
- Accurate mark to market (aggregate physical assets + contracts; intrinsic vs extrinsic splits)
- Headroom vs risk limits (& how utilisation is evolving)
- Daily P&L & risk attribution (what is driving changes one day to the next)
- Credit exposure (in aggregate & by key counterparties) and cashflow position & requirements.
Sounds easy? It is surprising how often issues with these basics lie behind major problems in market shock events.