It has been an explosive winter in North West European power markets. Elevated prices, spikes and volatility have suddenly returned, in stark contrast to the relatively stable conditions that have become the norm over most of this decade.
System stress has been highest in the French and UK power markets. Extended outages at nuclear plants in France decimated the system reserve margin, leaving the French market dependent on imports in periods of high demand. Across the English Channel, the UK power market is also confronting its tightest winter in history.
These conditions mean the IFA interconnector between the UK and France (2GW) has become a battle ground for available electricity. This has been reflected in a surge in volatility of the spread between UK and French power prices. The strong structural flow pattern from France to the UK has been temporarily replaced with a complex pattern of fluctuating flows and intra-day reversals. Today we look at the implications for interconnector capacity value.
How to think about interconnector capacity value
Cross border transmission capacity deconstructs into a locational spread option. In other words it provides the capacity holder with the right but not obligation to flow power between two countries.
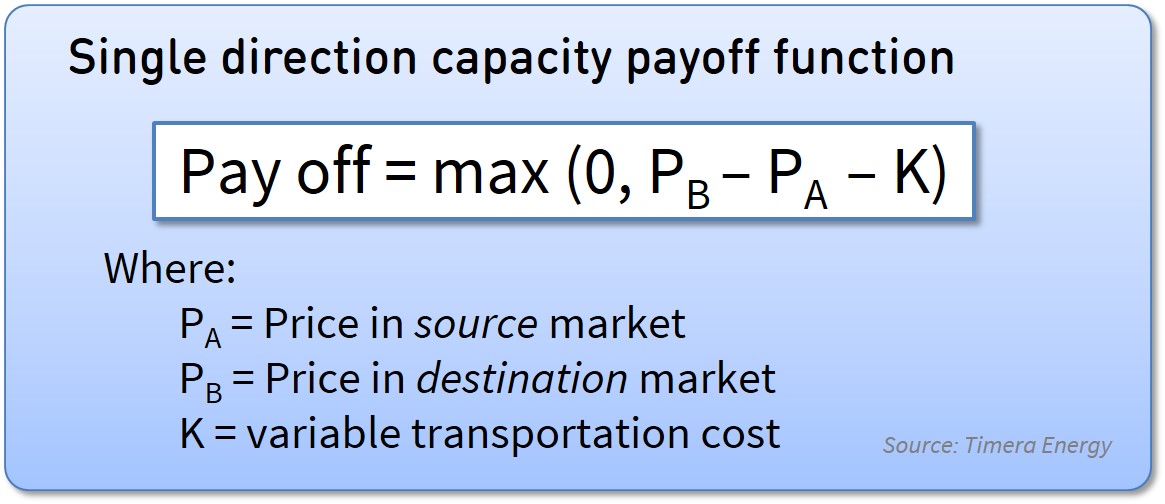
Power is flowed to realise a positive margin, if the price in Market A exceeds the price in Market B, allowing for any variable costs of flow (and vice versa). A simple payoff function is summarised in Diagram 1 below.
Diagram 1: Interconnector capacity payoff function
There are two key drivers of capacity value:
- The level of the price spread between the two markets, which drives the intrinsic value of capacity.
- The behaviour of price spread movement over time characterised by the volatility and correlation of power prices, key drivers of extrinsic value that can be realised from adjusting flows in response to fluctuations in the price spread.
These drivers have undergone a transformational change coming into the current winter.
UK vs French spread and flow dynamics
The last five years have seen relatively stable price spread conditions, with UK prices at a structural premium to France. There have been two primary drivers of this structural spread:
- Power prices in France (and across NW Europe) have been predominantly influenced by coal unit variable costs, which have been structurally cheaper than CCGT variable costs which set UK power prices.
- The UK carbon price floor (18 £/t above the EU ETS price) reinforces the generation cost premium of the UK over France.
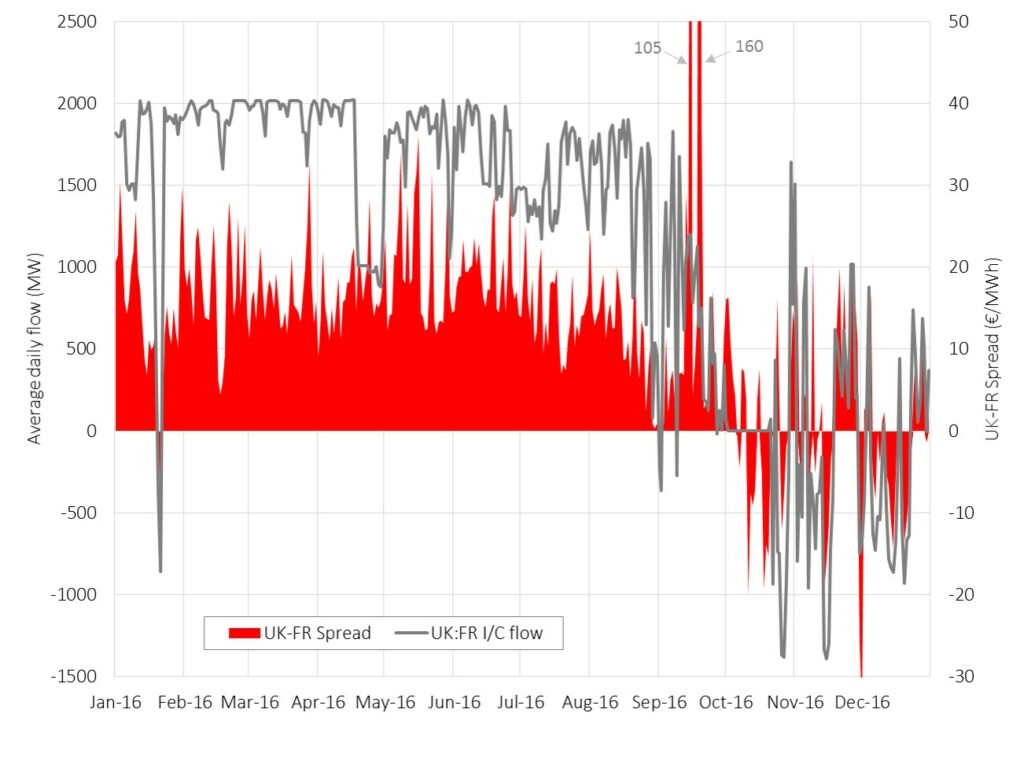
These factors continue to support a strong structural premium of UK over French power prices in the forward market. The Calendar 2018 UK power price is currently trading at around a 15 €/MWh premium to France, similar to its pre-winter level. But this structural forward spread dynamics has been disrupted in the spot market across the current winter as illustrated in Chart 1.
Chart 1 shows UK imports as positive flows (the grey line above the horizontal axis). The red line shows the UK vs FR power price spread, which is positive when UK prices are at a premium to France (and vice versa).
Several observations on the Chart:
- The strong structural UK vs FR price spread and associated flow pattern is evident from Jan until Aug
- A rapid transformation in spread and flows took place from September as the impact of French nuclear outages started to drive a substantial scarcity premium into French power prices (eroding the spread)
- The volatility of the price spread and fluctuations of flows has surged since the start of winter, reflecting a cross channel ‘tug o war’ as both the French and UK systems fight for available electricity
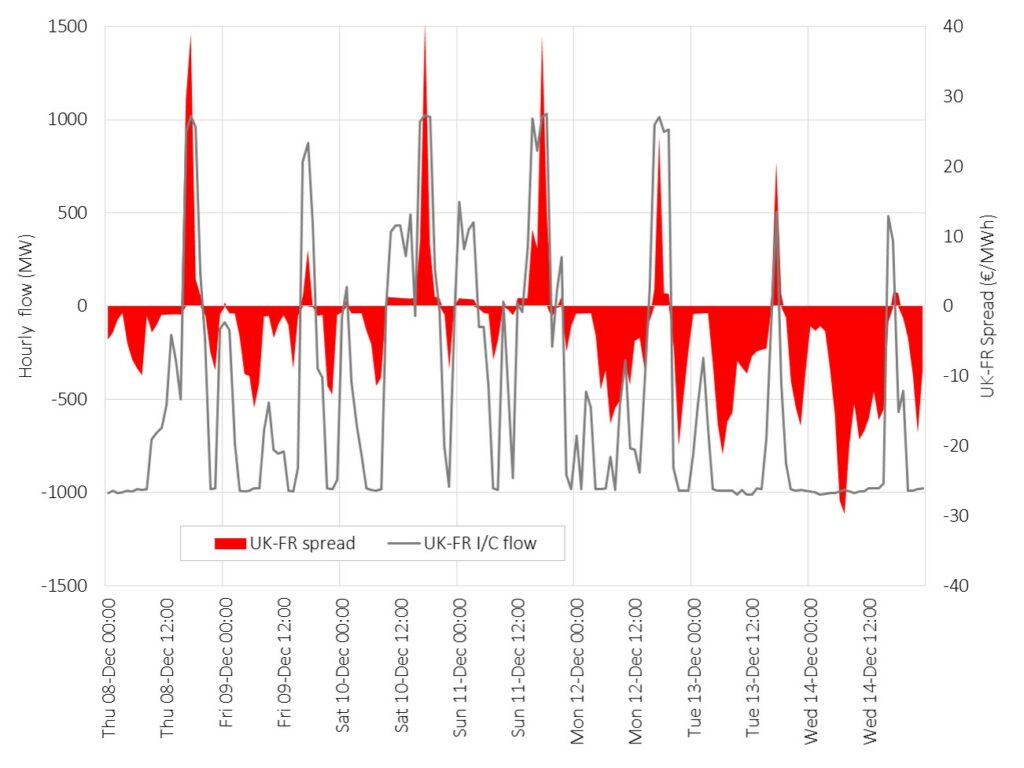
The dynamic behaviour of cross-channel spreads and flows is even clearer when viewed at an hourly level in Chart 2.
Chart 2 shows how cleanly participants can dispatch interconnector capacity against spot price signals using harmonised day-ahead auctions. This can be seen via the very strong relationship between the direction of price spreads and flows. This shows that capacity utilisation and dispatch is operating efficiently, as are the workings of the UK and French power markets in providing liquidity on each side of the interconnector.
Implications for asset owners and investors
Asset owners and investors love intrinsic value driven by structural price spreads. A high proportion of intrinsic value can be realised when selling capacity to market counterparties. This is because capacity buyers can hedge intrinsic value with relatively low cost & risk, and easily mark it to market.
But extrinsic value dynamics also play a key role in driving interconnector capacity value. This is particularly the case during periods of lower price spreads or higher spread volatility. Chart 2 illustrates how liquid hourly spot markets facilitate capacity buyers to precisely nominate flows to capture margin from cross border price spread volatility.
There are several important characteristics of intrinsic and extrinsic value that impact the risk and return on interconnector capacity:
- Structural spreads: Intrinsic value dominates interconnector margin during times of strong structural price spreads. Intrinsic margin is important in supporting the sale of capacity contracts, particularly long term contracts to facilitate debt financing.
- Bi-directional flows: The bi-directional nature of interconnector flows means that value loss in one direction is typically replaced by value gain in the other. In other words it is the absolute level of the price spread that drives intrinsic value, rather than whether the spread is positive or negative.
- Extrinsic value offset: During periods where price spreads decline (i.e. when the spread option moves ‘close to the money’), extrinsic value increases significantly (e.g. across the current winter). Increasing extrinsic value partially offsets the decline in intrinsic value. This inverse relationship provides important downside margin protection.
- Extrinsic value capture: There is a higher cost and risk in monetising the extrinsic value of capacity (relative to intrinsic value), given it requires a more complex and higher volume prompt trading strategy. This is reflected in deeper price haircuts when selling capacity contracts.
Robust valuation of interconnector assets can be challenging. Spread optionality is complex and there are practical challenges in monetising capacity, whether via selling long term contracts or via shorter term capacity sales. But accurately capturing the dynamics of intrinsic and extrinsic value set out above is a good starting point for developing an accurate quantification of asset risk/return.
Article written by Olly Spinks & David Stokes