The European gas options market is still in a relative state of infancy versus for example the crude options market. But as TTF gas hub liquidity grows, the options market continues to mature.
This is improving the quality of information on volatility expectations that can be implied from TTF option prices. These implied volatility data provide an interesting contrast to the more common backward looking historical volatility measures.
In today’s article we take a look at how TTF implied volatility is evolving as well as looking at the TTF ‘volatility surface’.
Front month implied volatility
Traders have a preference for implied volatility over historical volatility as a benchmark, to the extent that reliable options price data are available. Implied volatility is:
- Market based (vs calculated via formula from historical prices)
- Current i.e. today’s option prices provide an ‘up to date’ view on current market conditions
- Forward looking e.g. implied volatility from a month-ahead contract provides a view on average volatility of the month ahead contract up to expiry (vs observed volatility over an historical period).
Chart 1 shows the evolution of implied volatility for the TTF ‘at the money’ front month options contract.
Chart 1: TTF front month implied volatility (2012-18)
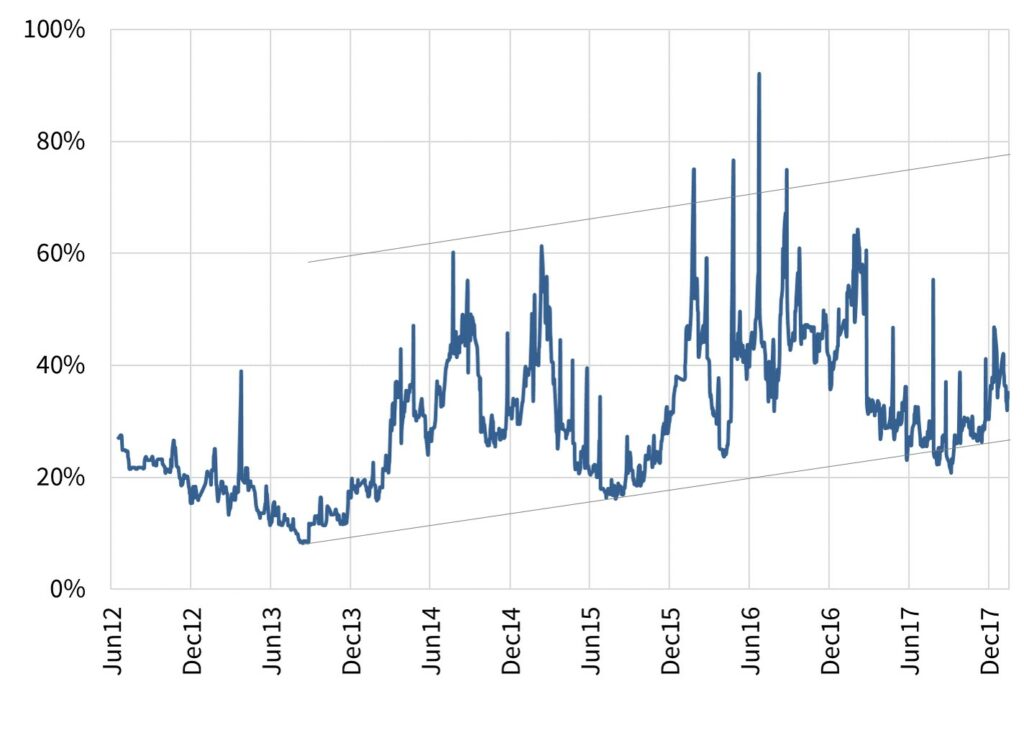
Source: Timera Energy, Marex Spectron
The chart shows TTF implied volatility recovering since 2013. Volatility evolution displays somewhat of a seasonal pattern, with levels lower across summer (with the exceptions of summer 2014 & 2016 which were influenced by broader commodity price volatility and events at NBP).
The level of volatility across these summer dips has risen since 2013. The level of higher volatility periods (usually but not always associated with winters), have also been rising.
Jumps in implied volatility (for specific maturities) tend to come from sharp changes in underlying option prices. These can be quickly eroded away as traders see value or arbitrage opportunities open up across particular contracts, causing prices to correct.
While a broad uptrend is evident across this period, volatility has fallen back in 2017 from significantly higher levels in 2016. It remains to be seen whether this softening is a temporary setback within a broader up trend. A more pronounced rise in NBP volatility across 2016-17 suggests that it is.
Historical vs implied volatility – the basics
If you are familiar with these measures of volatility feel free to jump ahead to the next section.Historical volatilityHistorical volatility involves a retrospective calculation based on observed market prices over a defined period in history. It is a statistical measurement of the realised price dispersions of a specified contract over a specified time period. For example: “Day-Ahead volatility in Apr 2017 was 55%”. Historical volatility is measured based on a dataset of realised historical price return observations. The wider the distribution of historical price returns, the higher the volatility measurement (and vice versa).Implied volatilityThe level of volatility expected by the market can be ‘implied’ from the prices of traded gas options. For example: “the Jan 2018 TTF at the money gas call option contract has an implied volatility of 40%”.The key to being able to imply volatility from traded asset prices is that the level of volatility is an input into the standard pricing formula (e.g. Black Scholes) used to value optionality. Option prices are a function of strike price, underlying gas price, time to expiry and volatility. So if the price of an option is known, then implied volatility can be backed out using an appropriate option pricing formula.
TTF implied volatility surface
The second aspect of implied volatility we look at is the ‘surface’ across multiple different option times to maturity and contract strike prices. Strike prices are shown as deltas, where a 0.5 (or 50) delta option is ‘at the money’. The TTF surface is shown in Chart 2.
Chart 2: TTF implied volatility surface
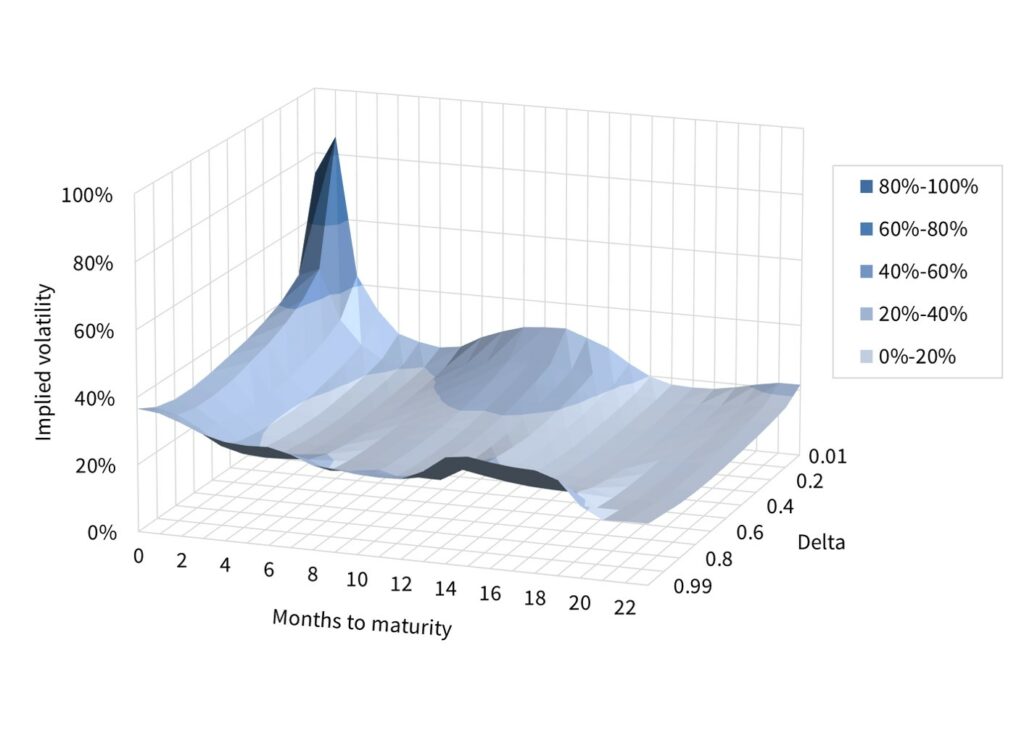
Source: Timera Energy, Marex Spectron*
In mature options markets, volatility surfaces can be very insightful into the market’s expectations of potential price behaviour. It is important to be wary of reading too much into the TTF implied volatility surface given limited liquidity in a number of options contracts. However some broader observations can be made.
The volatility surface shows some classic shape characteristics:
- Decreasing term structure of volatility i.e. volatility falls as time to maturity increases
- Volatility smirk / smile, where higher volatilities are observed for ‘out of the money’ options
- Seasonal shape reflecting expectations of higher volatility (higher option value) during winter delivery periods
The high premiums for month ahead ‘out of money’ call options are influenced by contract illiquidity, but are consistent with the risk of sharp prompt price increases. The price of these call options reflects an insurance premium for protection against shorter term gas price spikes.
*For more information about the Marex Spectron implied volatility data please contact Richard Frape.