The US dollar has surged since the election. The dollar index hit its highest level in over a decade last week suggesting that the next leg of the dollar rally that started in 2014 may be under way.
A renewed dollar rally is important for energy markets because of an historically negative correlation between the dollar and commodity prices. But the factors driving the current dollar rally may have broader implications for commodity markets. A recent rise in US bond yields and a recovery in cost and wage benchmarks suggest the first uptick in inflation since the financial crisis.
USD and commodity prices
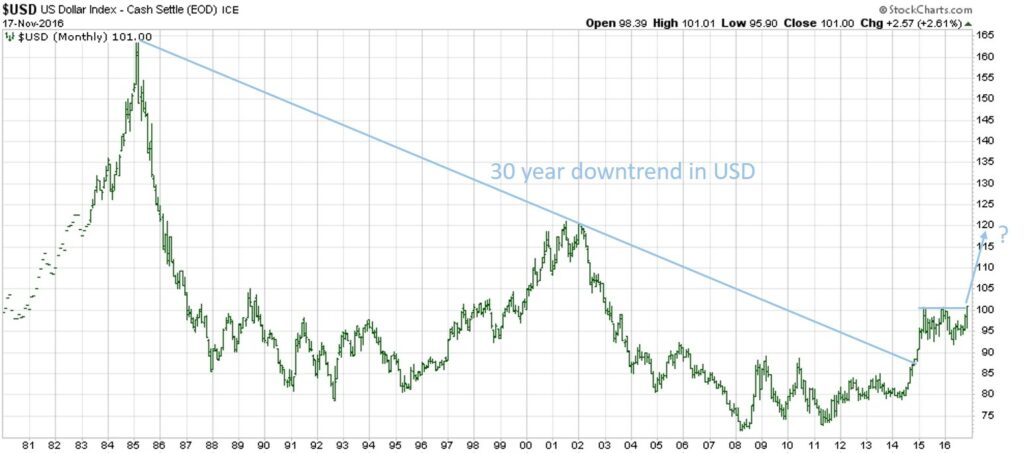
Chart 1 shows how the USD rally in 2014-15 broke a 30 year downtrend extending back to the mid 1980s.
The USD has been consolidating in a range for the last 18 months (since early 2015). But last week the US dollar index (against a basket of major currencies) broke out of this range, rising to levels not seen since 2003. If this breakout holds, it may foreshadow the next leg of a USD rally into 2017.
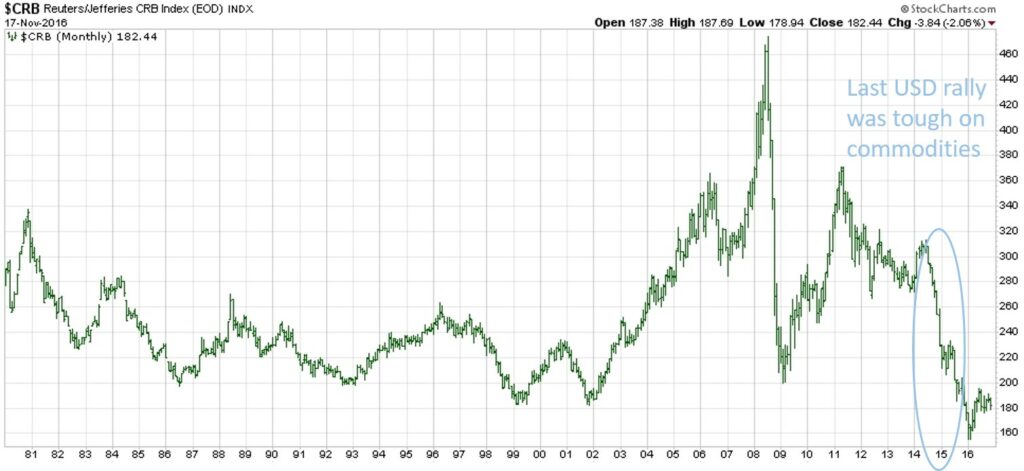
We have written before on the important negative correlation between the USD and global commodity prices (e.g. oil and coal). The dollar rally in 2014-15 coincided with a sharp decline in commodity prices, shown in Chart 2.
After forming what looks to be a major bottom in Q1 2016, commodity prices have surged this year, defying consensus expectations of a prolonged slump. This commodity price rally has happened against a backdrop of a range bound dollar.
If the dollar resumes its uptrend in 2017, history suggest this may create some headwinds for the current rally in commodity prices. There was already evidence of this last week, as the US dollar breakout coincided with sharp corrections in a number of commodity markets including coal.
Look to yields and inflation to explain USD rally
The 30 year down trend in the USD has coincided with a similar downtrend in US bond yields (the implied interest rates on longer term fixed income assets). This is no coincidence given yields strongly influence the cross-border capital flows that drive exchange rates.
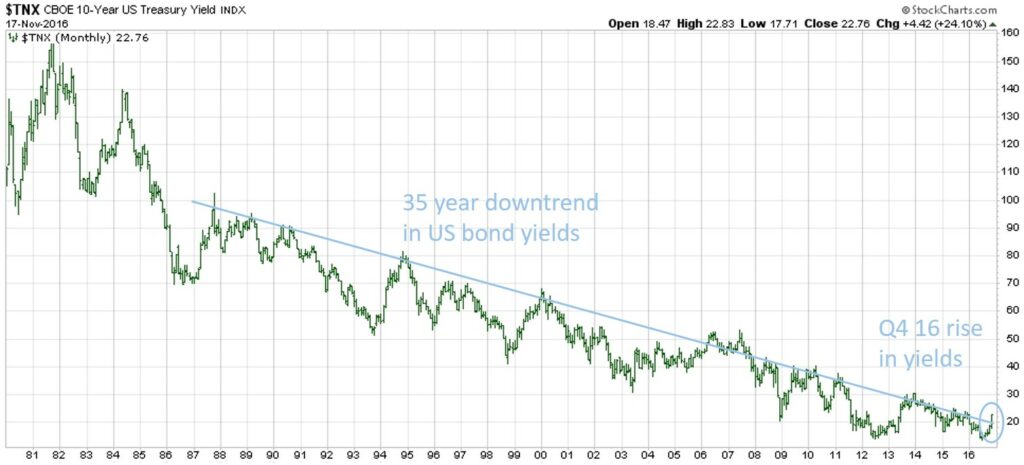
Chart 3 shows the evolution of the US 10 year bond yield (which acts as a benchmark for global yields).
In July 2016, US yields retested the all-time historical low level set in 2012 at around 1.35%. But yields have recovered rapidly since. Since the US election week, US 10 year yields have seen their sharpest two week rally in 15 years. As a result US yields have broken out of their major post financial crisis downtrend (as shown in Chart 3).
There are two key factors driving this move higher in longer term interest rates:
-
- Monetary policy: Global central banks appear to be stepping back from more extreme easing monetary easing policies. Support for a push towards negative yields is waning given the damage it is doing to the balance sheets of financial institutions (Deutsche Bank being a prominent example).
- Inflation flag: Early signs of a recovery in inflation are appearing on the horizon, after a post financial crisis period of strong disinflationary forces. The commodity price rise in 2016 looks to be an important contributing factor.
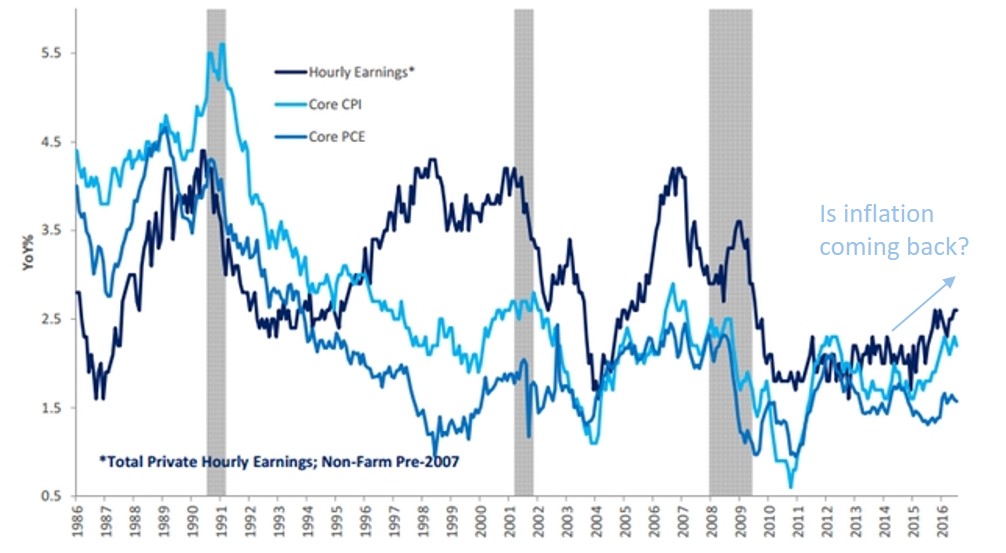
Chart 4 shows a set of US inflation benchmarks moving towards their highest levels since the financial crisis. The recovery in some forward inflation indicators, such as the Economic Cycle Research Institute Forward Inflation Gauge, is even more pronounced.
Chart 4: US inflation benchmarks

Source: DoubleLine Capital
What could this mean for commodity prices?
The USD may cause some headwinds for commodity prices in the near term. It is possible that a strong 2017 USD rally could even cause a sharp correction in commodity markets. But there are other factors that suggest that any weakness is likely to be temporary.
China has allowed its currency to weaken significantly against the rising USD since 2014, particularly across the second half of 2016. That should represent a shot in the arm for Chinese export industries which are a key driver of global commodity demand.
Periods of inflationary pressure have historically coincided with rising commodity prices. This is supported by the logic that commodities are priced in currency terms (predominantly in USD). And inflation erodes the value of the currency denominator.
Finally commodity market fundamentals are cyclical in nature. There is a well spoken saying that the cure for low commodity prices is low prices. Commodity prices have been trending down since 2008 and have slumped since 2014. This is resulting in a hiatus of investment in new supply and the curtailment of existing supply.
Cycles occur at different paces in different markets. For example, oil and coal markets look to be more advanced in the current cycle than the gas market. But cycles also tend to be correlated across commodities given the broader macro drivers described above.
Despite near term dollar strength, evidence appears to be building that points to a major recovery in commodity prices over the next decade.
Article written by David Stokes and Olly Spinks


