If you could gaze into a crystal ball and see the future path of one energy market variable over the next 5 years, what would you choose?
“A lower vs higher LNG demand growth trajectory may translate into a 3-5 $/mmbtu difference in the TTF price curve.”
The evolution of global LNG demand would be pretty high up our list. The logic goes something like this:
- LNG supply over the next 5 years is relatively clear (given 5 year supply project lead times)
- So global LNG demand will determine the level of LNG flowing into Europe (as the global swing market) and be a key driver of European gas hub price evolution
- Gas hub prices are the primary driver of wholesale power price levels across Europe
- The evolution of wholesale power prices will be a key driver of the economics of wind & solar capacity investment and knock on effects across power markets.
As the world emerges from the Covid downturn, it is unclear yet whether LNG demand will follow the weaker growth trajectory seen across 2019-20, or return to the higher growth trajectory seen across 2016-18. The difference between a lower vs higher LNG demand growth trajectory could translate into a 3-5 $/mmbtu difference (9-14 €/MWh) in TTF gas price curves. That translates into the equivalent of around a 15-30 €/MWh impact on European wholesale power price levels.
In today’s article we look at 5 charts that shed some light on what we are learning about the ‘Covid escape trajectory’ of global LNG demand in 2021.
A significant shift across Q1 2020
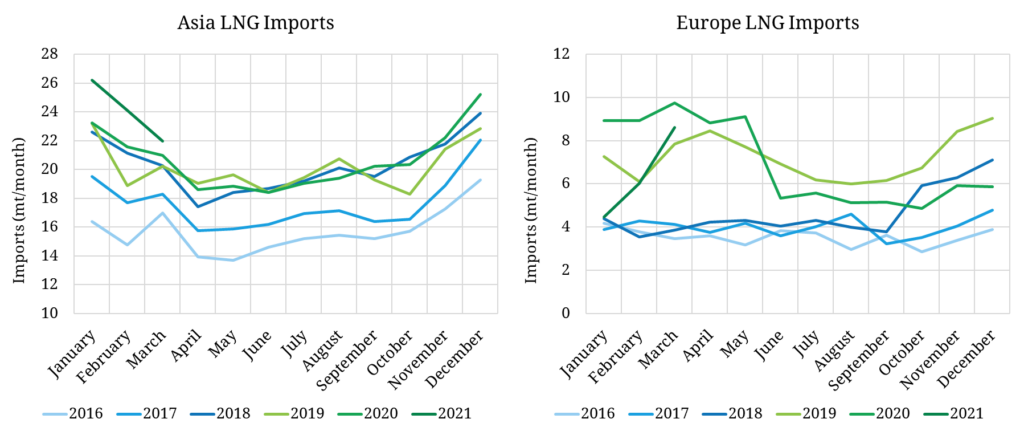
Our first two charts show the evolution of Asian & European LNG demand in 2021 compared to the last 5 years.
2021 started with a bang. A cold snap saw a big jump in Asian LNG demand in Jan 2021, following on from strong demand in Dec 2020. Gas markets in Japan, South Korea and China were all tight through this cold period and a lack of forward purchasing and low stocks in Japan and South Korea saw a well documented scramble for LNG cargoes.
European imports plummeted as a result (as can be seen in the right hand chart), with Jan 2021 imports falling back to pre 2019-20 glut levels (close to Europe’s minimum requirement).
The Dec – Jan period had all the characteristics of a tight LNG market on a high demand trajectory. That picture changed in Mar 2021, as can be seen by the rise in surplus LNG flowing into Europe in the right hand chart (with European imports up 2.6 mt in Mar, although still 0.8 mt lower year on year).
Asian LNG demand has fallen significantly since Jan, consistent with the usual seasonal decline as the winter subsides. Softer demand is also a function of aggressive buying in Jan (particularly in Japan), which led to some overstocking. Japanese utility restocking over the mid-Jan to mid-Feb was higher than any other month on month inventory build over the last ten years.
However the left hand chart shows Asian LNG demand remains on a higher trajectory in 2021 versus previous years. Strong Chinese demand is an important factor behind this increase, with India playing an interesting price response role (pulling back on imports in Jan when prices were high and increasing imports in Mar as prices declined).
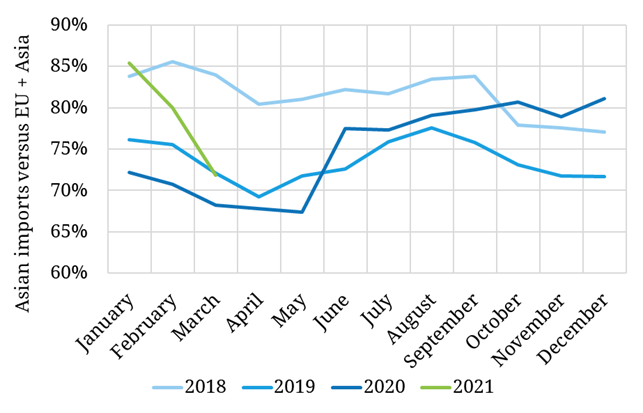
A barometer of LNG market tightness
Our next chart shows Asia’s share of combined Asian and European LNG import volumes. When Asia’s share is higher (e.g. 75% plus), it is indicative of a tighter market with supply being diverted from Europe to service strong Asian demand. When Asia’s share falls (e.g. below 75%), then it points to a softer market with surplus cargoes flowing to Europe.
This chart illustrates well the extent of market tightness in Jan 2021 (above levels seen in 2018, the last time prices jumped). It also shows relative weakness in Mar 2021, with Asia’s share declining to 72%.
The Mar 2021 dip in the ‘Asian share’ barometer, flags a potential softening in global LNG demand, after a very strong start to the year. This is something to keep an eye on as the year progresses, but we wouldn’t read too much into the Mar data yet.
Asian JKM prices and time charter rates have been rising across the last month (as suppliers float cargoes into the stronger May and June JKTC market, tying up tonnage), an indicator of stronger underlying demand. Netback prices into summer are also pointing to a recovery in Asia’s share of demand.
Changes in LNG flows also tell an interesting story
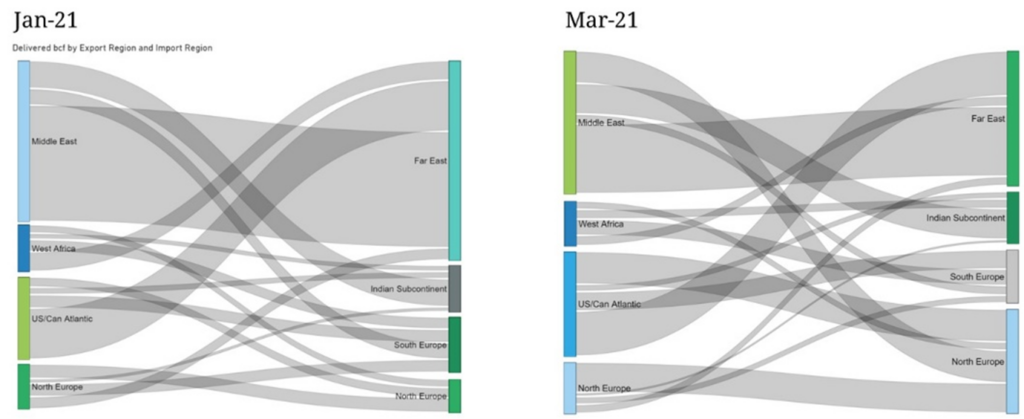
Our final two charts show a Sankey chart view of global LNG flows from grouped supply source to demand source.
The supply sources are ordered from top to bottom by proximity to the Asian markets. These flow diagrams are useful as an illustration of marginal cargo flow patterns which in turn reflect the underlying global market balance. For example in tighter periods, Asia needs to pull supply from greater distances, with an associated higher cost of diversion between Asia and Europe (which feeds through into higher JKM prices).
The global trade flows in Jan 21 and Mar 21 are a good case study of a tighter vs more balanced market respectively. Some observations on drivers:
- In Jan, there are no Middle East cargoes flowing into North Europe i.e. flexible gas is being diverted away from liquid NW European hubs to a tight Asian market e.g. Qatar not placing volumes into their capacity in South Hook.
- In a more balanced market in Mar, flows Middle East to North Europe flows picked up as Asian demand & prices softened.
- The proportion of Middle Eastern cargoes being delivered to India rather than the Far East also increased in Mar (reflecting within basin arbitrage dynamics between the two periods).
- Also consistent with a softer market in Mar is the reduced volume of West African cargoes leaving the Atlantic basin (vs heading to Asia as in Jan).
The final interesting observation from these charts relates to the US which is now the key swing supplier in the global market (reflected in forward market JKM-TTF spreads). This is clearly illustrated by a more balanced split of US flows by basin in Mar, compared to the majority of cargoes being pulled to Asia in Jan (despite high freight rates and Panama canal delays).
We will return with another article soon that looks at how flexible cargo flows drive marginal pricing dynamics & spreads across JKM and TTF.