Several key structural market trends are reshaping the way that LNG is transacted.
The US has emerged as a key provider of destination flexible supply, with almost 100 mtpa of committed export capacity. Destination clause restrictions in existing supply contracts are also being relaxed or removed, helped by the negotiating balance swinging in favour of buyers in a well supplied market and competition authorities declaring these clauses anti-competitive.
Increasing demand uncertainty in traditional LNG markets is eroding appetite for long term and inflexible contracts. This uncertainty is being caused by evolving policy initiatives (e.g. the phasing out of coal & nuclear in Sth Korea), growth of renewable generation, ongoing market liberalisation and volume risk around Japanese nuclear restarts.
The rise of LNG portfolio players is rapidly eroding the traditional producer to supplier contracting model. This trend is being reinforced by the aggressive growth of commodity traders (e.g. Vitol, Trafigura & Gunvor) who are boosting market liquidity and shorter term contracting.
Reinforcing the trend to shorter contract durations, the next wave of LNG supply that is now taking shape is featuring the rise of equity offtake models (as opposed to long term contracts). The recently FID’d LNG Canada project is a good example, where project developers will market their own equity share.
In today’s article we look at 5 charts that summarise the ongoing impact of these trends. The charts draw on data from the IEA’s recently published ‘Global Gas Security Review’.
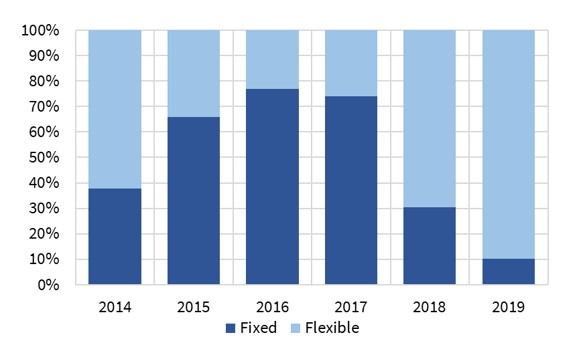
Chart 1 shows the level of destination flexibility in supply contracts concluded over each of the last 6 years. It includes contracts linked to FID’ed projects as well as portfolio sourced contracts.
The higher levels of flexibility in 2014-15 reflect the first wave of US export project FIDs. From 2017-19 a clear trend can be seen away from traditional fixed delivery point DES contracts towards greater diversion flexibility.
Contract duration has been falling in parallel, also reflecting the need for greater flexibility (although the 2018 FID of LNG Canada on an equity offtake basis somewhat skews recent stats). As long term DES contracts roll off, they are being replaced by destination free, shorter duration contracts. For example JERA sourced a 3 year, 2.5mt/year contract when its 15 year, 4.8 mt/y contract with Petronas ended in 2018.
Chart 2 shows the volume of gas indexed LNG supply volumes across the 2014-24 horizon (again including new projects and portfolio deals). A clear increase in gas indexation can be seen, with contract prices linked to traded hubs (e.g. Henry Hub, TTF, JKM) as opposed to traditional oil-indexation.
The rise of gas indexation reflects an increasing trust in gas price benchmarks as liquidity grows. It also reflects increasing mismatches between oil-indexed and end-user prices. There have been reports of coal indexed Asian LNG contracts, which is more logical than oil.
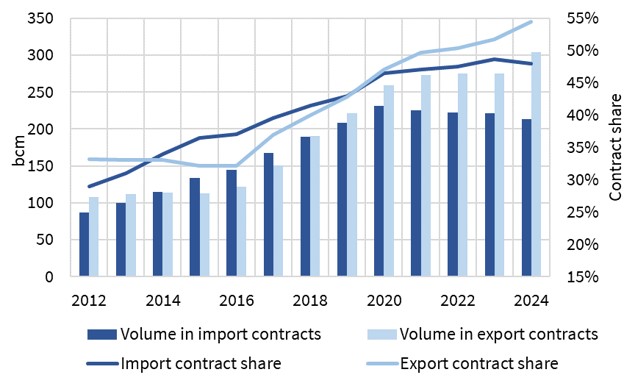
The chart shows LNG contracts without a specific source (export contracts) or destination (import contracts). This provides a clear illustration of the rapid growth in the role of LNG portfolio players and the resulting breakdown in traditional producer source to supplier destination contracting.
As portfolio players disaggregate ‘bought’ from ‘sold volumes it creates a more complex portfolio optimisation & value management challenge. This is also creating a growing requirement for hedging, balancing & adjustment actions in the traded market, which is supporting liquidity growth.
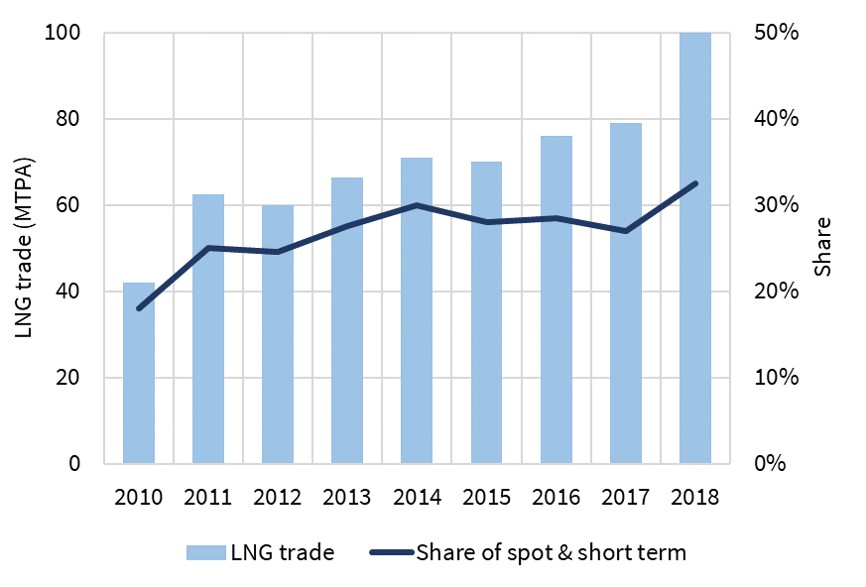
This can be see in the rise in spot & short term LNG trade in Chart 4. The rapid increase in flexible US export volumes coming online across 2018-20 should support this trend.
LNG portfolio management is not just a spot problem. It is increasingly involving the forward hedging of portfolio exposures with financial products e.g. the hedging of gas indexed & diversion flexible US LNG contracts against TTF and JKM forward prices.
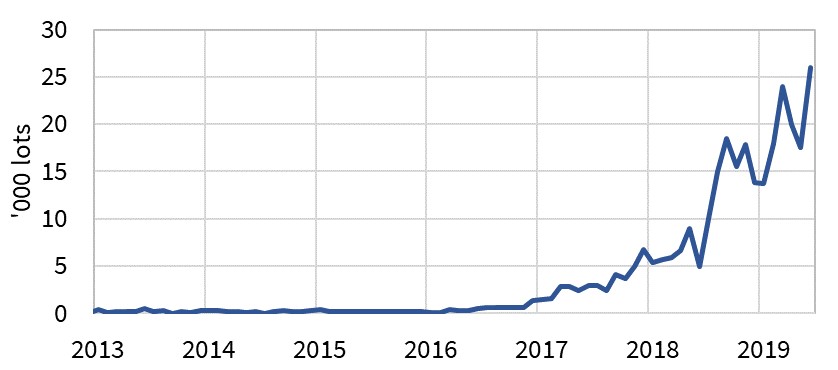
Chart 5 shows the rapid growth in volumes of JKM swaps across the last two years. Portfolio players are using swaps and futures to lock in prices on forward delivery volumes. These hedge positions can then be adjusted and optimised as market prices move, to manage risk and create value.
Five takeaways
In summary, the charts show 5 trends that are set to continue to shape the LNG market.
- Contracts are becoming more flexible & shorter duration
- Gas indexation is rising and replacing oil
- The role of portfolio players is growing, disaggregating source from destination
- As a result, spot & short term trading of LNG is growing…
- … and portfolio exposure management is also driving an increase in forward liquidity
These trends increase the complexity of the LNG market. But they also increase the ability to create value and manage risk.
